


Key Takeaways
- Please send the post title and full body so I can write takeaways tied to the actual argument, numbers, and recommendations.
- I’ll tailor the bullets for growth-focused residential and multifamily operators managing 10-2,000 units in the US or Canada.
- Once I have the article, I’ll return only this HTML block with 3 to 5 skimmable, specific bullets.
Research Summary: The dynamics of the U.S. housing market are shaped by various regional and state factors, with the country's overall economic activity driving demand for real estate as a critical production factor. Despite facing cyclical challenges, such as declining GDP, increasing interest rates, and dropping deal flow, the U.S. real estate industry has demonstrated resilience and adaptability to market changes. As the market strives to overcome these obstacles, it continually evolves and adapts to new conditions.
The COVID-19 pandemic has had a significant impact on the U.S. economy and the real estate industry in 2020, transforming how residential real estate properties are perceived and used. The pandemic forced people to reevaluate their housing needs, with an increased focus on home offices, outdoor spaces, and proximity to essential services. However, as the global health crisis gradually recedes, experts anticipate a period of recovery and growth for the real estate market. The following statistics provide valuable insights into the current performance of the U.S. housing market.
For easier access, we broke down the data in the following ways:
Market Overview | Homeownership and Rentals | Luxury Real Estate | Homebuyers and Sellers | Prices and Sales | Demand and Supply | Best Real Estate Markets | Trends by State | Competitive Landscape | Forecast 2025
Market Overview
The U.S. housing market has faced significant challenges in recent years, including skyrocketing mortgage rates and rental prices, inflation, and increasing demand exacerbated by a shortage of housing inventory. Despite these obstacles, the housing market has continued to grow and remains a testament to the strength of the U.S. economy. This strength instills confidence in people, encouraging them to engage in house purchases or upgrades. To gain a deeper understanding of the U.S. housing market, consider the following insights:
- In April 2023, the average sales price of residential real estate properties was $501,000.
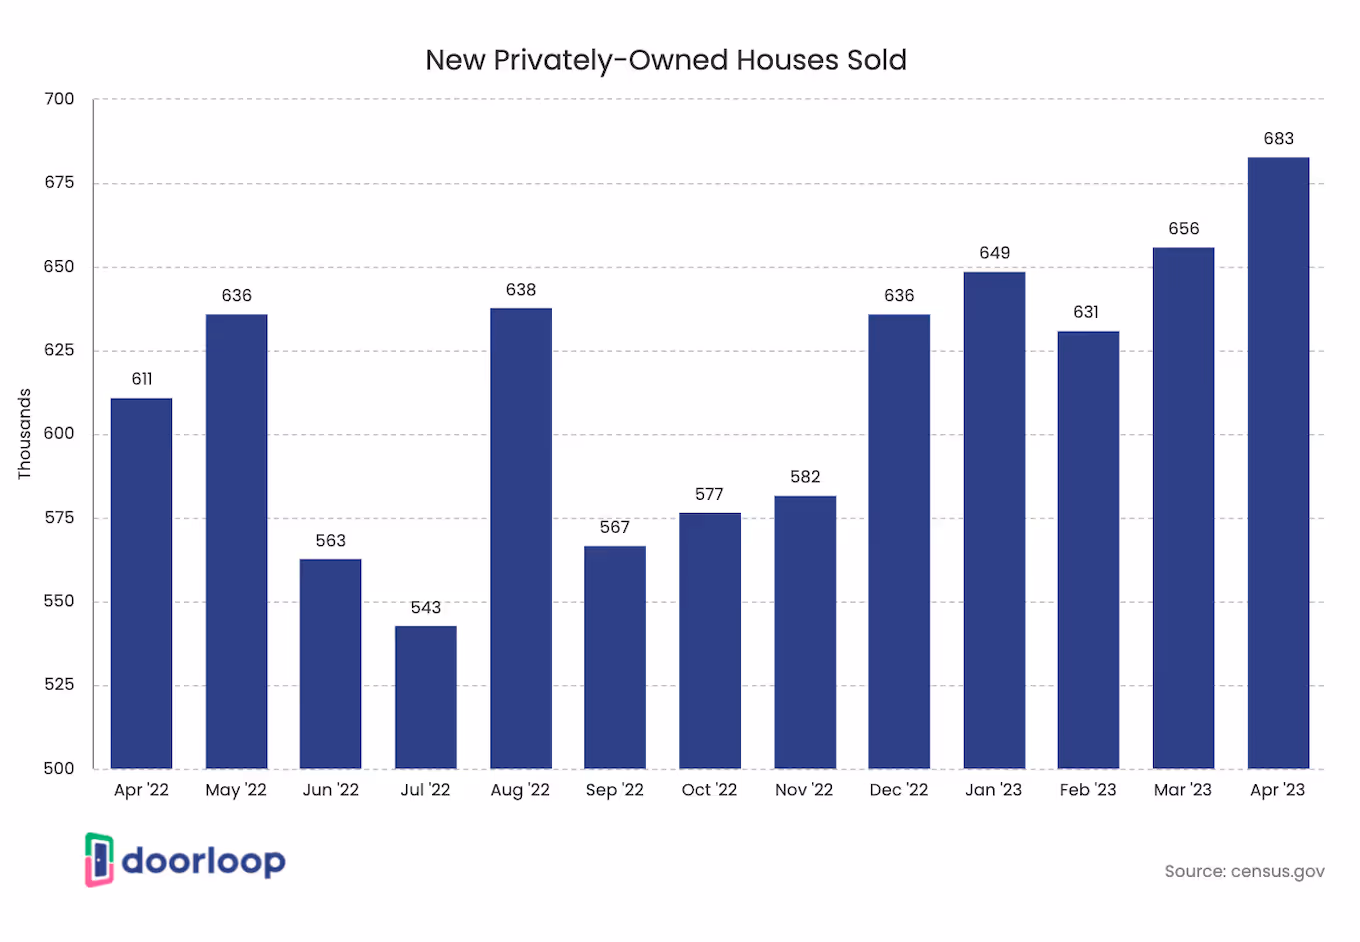
In April, there were 683,000 sales of new single-family houses. The seasonally-adjusted estimate of houses available for sale during that month was 433,000. Additionally, the median sales price of the new houses sold in April was $420,800. Notably, there has been a recent uptick in new home sales over the past few months.
- In March 2023, home prices in the U.S. dropped by 3.3% compared to 2022.
The median price of homes sold was $400,698, and there was a 19.5% year-on-year decrease in the number of homes sold. In March of the previous year, 550,744 homes were sold, while this year only saw 443,602 homes sold.
- As of March 2023, the number of homes for sale in the U.S. has increased by 59.9% compared to the previous year.
This includes existing homes, single-family homes, new builds, condos, and townhomes. Despite the increase in supply, the median home price has experienced an annual increase of 6.3% to reach $424,495.
- Existing home sales in March 2023 dropped by 2.4%.
Pending home sales dropped by 5.2% month-over-month and 23.2% year-over-year. However, it is worth noting that the month-over-month sales have remained steady in the Northeast, but declining in the other three U.S. regions. It is important to mention that every American region demonstrated year-over-year decreases.
- In February 2023, housing starts rose by 9.8% to reach a seasonally adjusted annualized rate of 1.45 million.
It was the highest in five months and surpassed the market forecast of 1.31 million. This indicates a potential resurgence of strength in the residential real estate market.
- In January of 2023, housing starts had 1.309 million as a seasonally adjusted annualized rate of 1.309 million, a drop of 4.5%.
It was the lowest since June 2020, and quite below market projections of 1.36 million. Single-family housing starts also declined by 4.3% to 841 thousand, and there was a decrease in the starts for units in properties with five units or more by 5.4% to 457K.
- In February 2023, the number of home sales increased by 14.5%, marking the end of 12 consecutive months of decreases.
However, it is further projected that overall home sales this year would decline by 18.4%, which is a housing recession that is not troublesome since home prices aren’t in a recession.
Homeownership and Rentals
Homeownership in the U.S. is often seen as a symbol of stability, as the housing market has historically shown an appreciation in value over time. Although the percentage of Americans who own a home is not particularly high compared to other developed economies, it is also not particularly low. Although homeownership is undeniably a part of the American dream, many people still prefer renting due to the rising cost of homes. Renting has become the more affordable option, as it allows renters to save on expenses such as insurance, taxes, maintenance, upkeep, and recurring costs. Here are some insights our research has uncovered about homeownership and rentals:
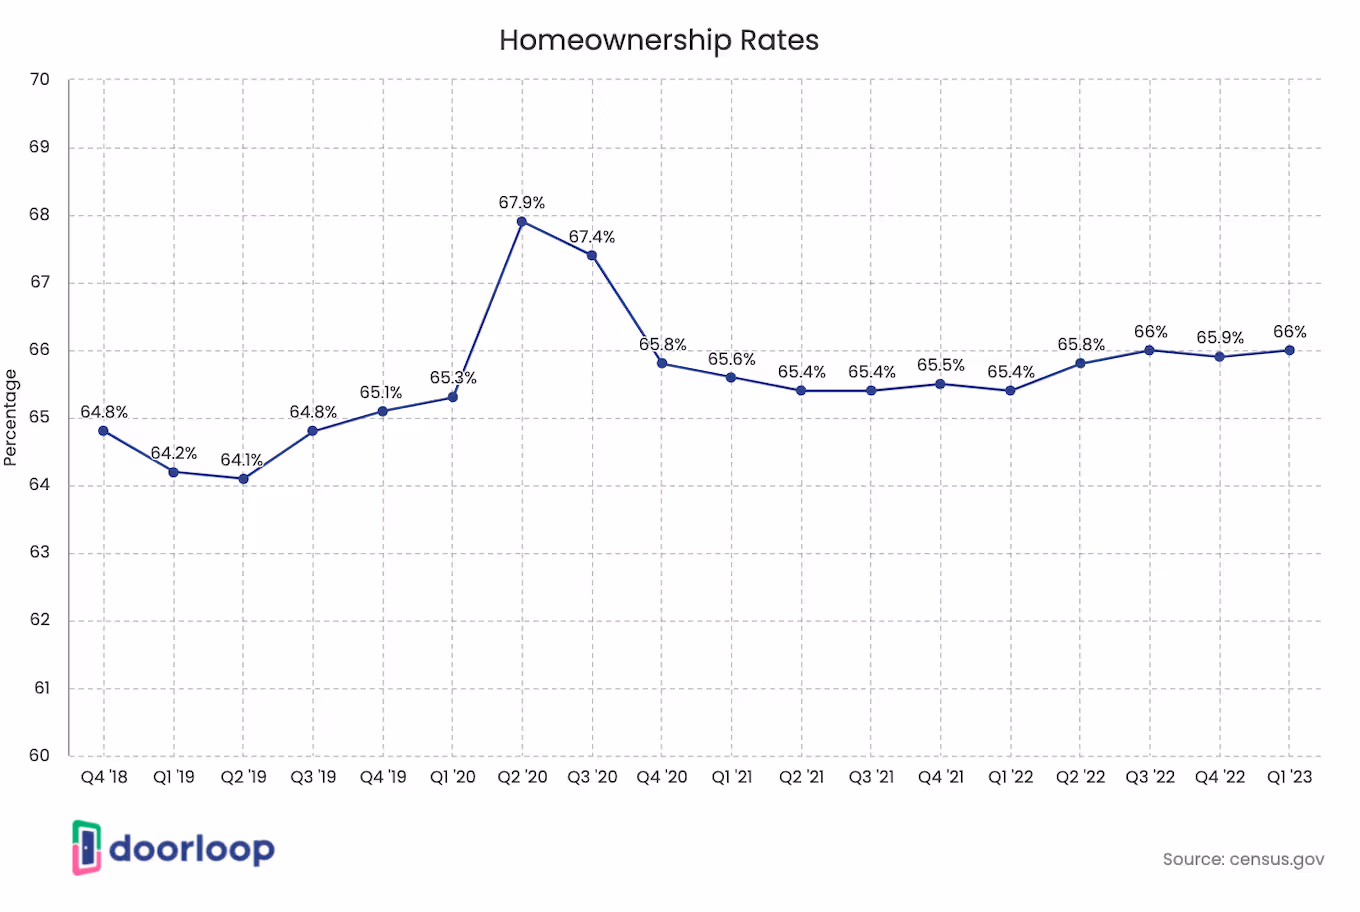
- In September 2022, U.S. homeownership increased to 66%, or 230 million Americans, a slight rise from 65.80% in Q2 of the same year.
However, it is projected that by the end of the first quarter of 2023, homeownership will drop to 65.50%. Despite this, the increase in homeownership suggests that more people and families can now afford to purchase a home, seeking social stability.
- In Q3 2022, the Midwest had the highest rate of homeownership at 70.1%, followed by the South at 67.5%.
In the Northeast, the homeownership rate was 63%, while in the West, it was 62%. For agents seeking ideal locations, the Midwest offers promising options such as Michigan, South Dakota, and Iowa.
- In Q1 2023, 94% of the 572 counties analyzed were found to be less affordable than their historical affordability averages, which is a significant increase from the 62% level reported in 2022.
However, there was a decrease from the 99% level in Q4 2022. Despite this trend, there may be some progress for house hunters as buying conditions could be improving.
- From Q4 2022 to Q1 2023, the countrywide price of the median single-family home and condo sat at $320,000.
It was up less than 1% from Q4 of 2022 to Q1 of 2023 and is virtually the same as the typical $318,000 price in Q4 of 2022. During the second half of 2022, the trends have tailed an 8% reduction in the national median during 2022’s second half.
- In Q1 2023, half of the markets analyzed required annual wages of over $75,000 to afford major costs on the median-priced home.
This applied to 285 or 50% of the 572 markets studied. It's worth noting that the top 25 highest yearly wages needed to afford typical homes are located on the West or East coasts.
- As of February 2023, the average monthly rent for an apartment with two bedrooms in the U.S. had increased significantly to $1,320, up from $1,282 in the previous year.
It's worth noting that as of March 2022, rental prices had risen across all states, with some experiencing an increase of more than 20%.
- In Q2 2022, there were roughly 2.6 million units for rent left unoccupied.
Over time, the number of vacant rental homes in the U.S. has been declining gradually. As a consequence, rents are on the rise making it all the more challenging for Americans to find an apartment and get one they can afford.
- New York, NY had an average monthly rental rate for an apartment studio of $5,812 in 2022.
This means that it was the most expensive rental market for studio apartments in that year. Ranking second highest was Pflugerville, Texas, with an average rental fee of $4,451.
- In August 2022, the median rent for the 50 largest cities in the U.S. decreased by $10 per month.
This was the first decline in rental prices since November and was projected to be temporary, as rent prices were expected to increase throughout the rest of the year. While the rate of rent growth may be slow, it is uncertain whether rental prices will return to pre-pandemic levels.
- The year-over-year rental price increase is projected to rise from 5.8% in June 2022 to 8.4% in May 2023.
This is a significant increase from the pre-pandemic rent price gains of around 4% to 5% per year. Renters should expect to pay more, but they can reduce costs by considering suburbs or renewing their existing lease if it's affordable.
- Approximately 52% of rental owners surveyed see themselves as intentional investors.
On the other hand, 24% of rental owners see themselves as accidental landlords. These are individuals who either inherited a property they could not sell or owned a property that they could not dispose of, making renting the only viable option.
- In the first Q3 of 2022, 94.5% or nearly all of the multi-family unit starts were built for rentals.
Between 2012 and 2021, multi-family properties accounted for an average of 32% of housing starts. However, the increase in mortgage rates and rising prices in the purchase market led builders to shift their focus to the multi-family market.
Luxury Real Estate
The real estate industry has faced numerous challenges, especially since the advent of the global health crisis. However, the market for high-end properties has continued to thrive, with demand for luxury homes in vacation areas along the coast surging.
Various factors have fueled the growth of the residential real estate market in the U.S. These include the skyrocketing number of retirees, the rise of remote work, and historically low mortgage rates. Additionally, fear of populous areas such as cities has also pushed the market upward. To better understand the state of the luxury housing market, let's examine some figures.
- The U.S. luxury residential real estate market is projected to register a CAGR of roughly 3% within the 2019 to 2028 forecast period.
The luxury housing segment is currently experiencing high demand and is considered the most active in the real estate market. A number of buyers in the past two years have opted for larger homes with ample spaces for remote office and school work, providing an efficient place for social distancing.
- In January 2022, the top-priced 1% of homes for sale across the nation had a median price tag of $5.5 million.
This was an increase of 16.6% from last January. It is worth mentioning that increases in demand were for vacation and second-home spots, such as those along the coastlines, on lakes, on the beach, and in the mountains.
- Over the last few quarters, the luxury home market has witnessed a remarkable surge of 50% in prices.
Los Angeles is one of the most popular destinations for homebuyers and currently has the highest market share. The city is known for its exceptional and high-end luxury properties, which have a median cost of $1,250 per square foot.
About 62% of smart American homeowners believe enhanced security is the top benefit of smart homeownership.
Smart homes are quite popular in luxury real estate, offering features like mobile video security systems, electronic glass shades, and voice-activated entertainment systems that are in alignment with today’s tech-savvy world.
- In Q1 2021, the sales of luxury homes soared by nearly 42% y-o-y.
During the same period, the average time a typical luxury home spent on the market was 61 days, which was 38 days fewer than in the same period in 2020. It can be recalled that the demand for larger homes stemmed from the desire to have more spaces for offices, school work, and gyms.
- Smaller high-end single-family homes sold almost 19% faster than bigger ones.
The size of smaller single-family homes with high-end features often ranges between 2,500 square feet and 3,500 square feet. More and more affluent homebuyers are opting for smaller properties, particularly for their second or investment-home purchases.
- The three-month period ending on January 31, 2023, witnessed a significant decline of 45% in the sales of luxury homes, which are properties with a market value estimated to be in the top 5%.
Experts suggest that the decrease in the luxury home market can be attributed to the high mortgage rates.
- In the three months ending January 2023, the median price of luxury homes increased by 9% to $1.09 million.
This rise is largely due to the shortage of available luxury homes on the market. During the spring of the previous year, luxury home prices reached a record high of $1.1 million.
- In January of this year, the number of luxury homes for sale increased by 7.1% compared to the previous year, marking the largest jump since 2015.
This significant increase can be attributed to the low home supply a year earlier, which led to fewer home purchases.
- A drop of 6.6% year-over-year fell on the new listings of luxury homes as of January 2023.
Further, it is worth mentioning that new listings of non-luxury homes fell 22.5%, which was the second-biggest slump on record.
Homebuyers and Sellers
The residential real estate market in the U.S. is undergoing a transition, leading to a situation where buyers and sellers are facing challenges in aligning their perspectives. This impasse is driven by various factors that significantly influence their behaviors. However, there are opportunities to overcome this impasse, including the availability of better financing terms and the potential for compromise between the groups, which could help restore balance to the market. To gain a better understanding of the behavioral profiles of homebuyers and sellers, let's explore some insights.
- Between April to February 2023, 25% of home buyers across the U.S. sought to move to a different metro area.
The first five areas in the list of the top states homebuyers were seeking to transfer to were Florida, Texas, Arizona, South Carolina, and Tennessee. The top 5 states that homebuyers sought to move from were California, New York, the District of Columbia, Indiana, and Massachusetts.
- In 2022, 10% of recent home transactions were (FSBO) sales.
Among For Sale by Owner (FSBO) sellers, approximately 50% knew the homebuyer. It is worth mentioning that FSBOs usually sell homes below the selling price of comparable properties. In rural areas, 13% of homes were sold via FSBO, while in suburban areas, the figure stood at around 6%.
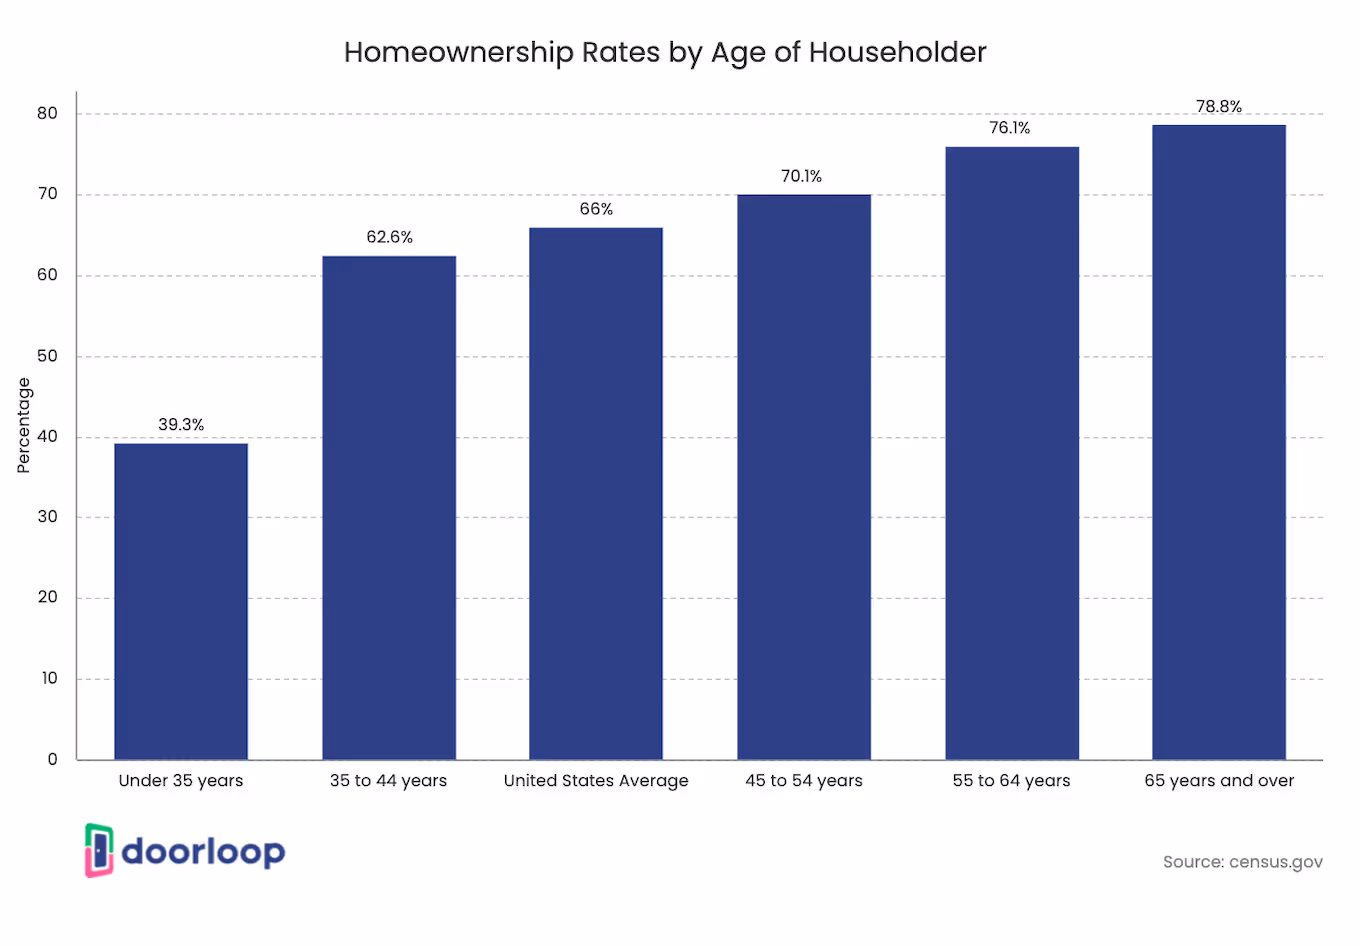
- In Q3 2022, homeownership rates among individuals aged 65 and older reached 79.5%, while those aged 55 to 64 had a homeownership rate of 74.6%.
In contrast, individuals under 35 had the lowest homeownership rate at 39.3%. This indicates that targeting older adults, particularly seniors, and retirees, may lead to better sales results.
- First-time homebuyers account for up to 26% of the real estate market, less than the previous year’s 34% market share.
These figures represent the lowest share of first-time homebuyers since 2021. In 2022, first-time buyers had an average age of 36 years old, up from 33 in 2021. On average, the age of repeat buyers increased to 59.
- Approximately 47% of homebuyers believe searching online first before contacting an agent is effective in finding a house.
While 47% of recent buyers resort to online searches for properties, 18% of buyers were found to first contact a real estate agent before doing anything else in their home buying process.
- Roughly 21% of home sellers stated that they sold their properties because they wanted to be nearer to friends and family.
Additionally, 11% cited reasons such as retirement or a loss of appeal in their neighborhood as the motivation for their relocation. The survey also revealed that 86% of house sellers enlisted the services of a real estate agent, while 10% managed the sale independently.
Prices and Sales
Residential real estate prices and sales are influenced by numerous factors, including the behavioral profiles of homebuyers and sellers, government policies, interest rates impacting price and demand, and economic cycles affecting real estate prices. It is worth noting that prices and sales vary across different states and may be influenced by various market changes. To gain a deeper insight into the recent trends in U.S. residential real estate prices and sales, let's examine them more closely.
- From February to March this year, the sales of newly constructed homes jumped up to 9.6%.
Although these sales were down 3.4% compared to the same period last year, the increase observed from February to March suggests a potential stabilization of the real estate market. Such an increase in sales may be partly due to the increase in mortgage applications.
- In March 2023, the median existing-home price for all types of housing was $375,700.
It is worth noting that this marked a 0.2% decrease compared to the median price of $363,000 in March of the previous year. However, in January, the median existing-home sales price jumped 1.3% from $359,000 last year.

- There were 445,653 houses sold in March 2023, down 551,581 from last March.
This means that on average, there was a drop of 19.2% year-over-year in the number of homes sold. When it came to the national average 30-year fixed rate mortgage rate, it was 6.5%, an increase of 2.4 points year-over-year.
- Existing home sales fell by 1.5% in December 2022.
The drop was to a seasonally adjusted annual rate of 4.02 million. On the same date, the overall number of housing units available was 970,000, a decline of 13.4% from November.
- In March 2023, there was a decline in existing home sales in the U.S. to 2.4% Multiple of Money (MoM) to a seasonally adjusted annual rate of 4.44 million.
Existing home sales included closed sales of single-family homes, condominiums, townhomes, and co-ops. The drop was down from 4.5 million market forecasts.
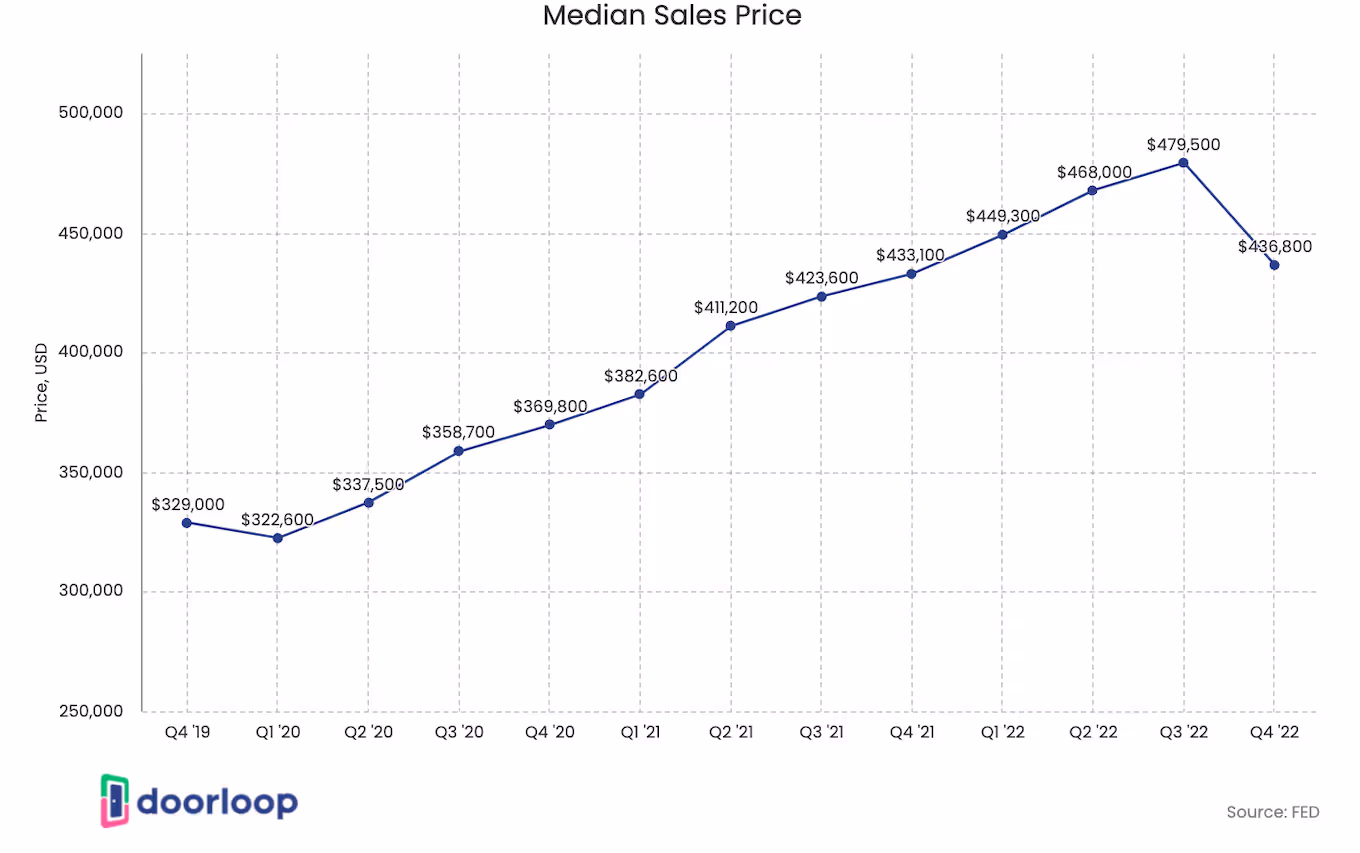
- In May 2022, the U.S. had an all-time high home sale price of $432,877.
It broke the previous record set in the previous year of $386,000. In December 2022, home prices in the country increased by 1.2% more than the previous year, with a median price of $388,100.
- In Q1 2023, New York’s median home sale price was $700K, a drop of 7.8% y-o-y.
The total number of transactions - 6,925 transactions- represented a 40.8% drop compared to Q1 2022. Its median price was $825 per square foot, down 9.1% y-o-y change.
- The total median sales price of condos in New York was $989K, down 1% year-over-year in Q1 this year.
There were 2413 transactions and the median sale price was $1k per square foot, down 1.3% year–over–year. On the other hand, Coops had a median sales price of $455K, down 9.9% y-o-y.
- In Q3 2022, the annual home price appreciation increased in 50 American states, with several experiencing more than 15% growth.
In Florida, the annual appreciation for single-family housing was particularly high, with a y-o-y price change of more than 25%. It is worth noting that the states with the lowest annual appreciation include Oregon, the District of Columbia, and California.
Demand and Supply
The United States housing market has been a hot topic in recent news. Various demand-side factors, including real income levels, property size, population, mortgage rates, and attitudes toward homeownership and debt, impact it. Meanwhile, on the supply side, inflation can increase the cost of constructing a building. Both supply and demand factors play a crucial role in shaping the residential market. But how do these fluctuations in supply and demand affect the U.S. real estate market? Let's delve into the statistics to find out.
- Phoenix had $200 per square foot in construction costs for multifamily homes In Q3 2022.
While Phoenix had one of the lowest construction costs for multifamily homes, Las Vegas and Portland had over $262 per square foot for single-family homes.
- In March 2023, the average months of home supply in the United States remained at 2 months, showing no change compared to the previous year.
Around 1,408,803 homes were for sale on the said date, up 7.1% year-over-year. It is further worth mentioning that when it came to newly listed homes, the number was 529,145, down 22.5% y-o-y and 44 for the median days on the market.
- In March 2023, 28.5% of homes sold below the list price.
This was a drop of 25.6 points year over year, and only 14.3% of homes had price drops, an increase from 6.0% of homes last March. The sale-to-list price was 98.9%, down 3.6 points y-o-y.
- In comparison to the previous year, December 2022 had 54.7% more homes for sale.
With the decrease in the supply-demand gap, the growth in home inventory offers relief to homebuyers by providing them with more choices and reducing the need for compromises. Additionally, the increase in home inventory can contribute to a decrease in home sale prices, making homes more affordable for potential buyers.
- As of February, the total housing inventory in the United States was 980,000 units, indicating a 5.4% increase from the previous year.
By the end of February, the inventory of unsold existing homes remained unchanged at 980,000 units. Nonetheless, this supply was larger than the previous month, resulting in a 2.9-month supply at the current monthly sales pace.
- In December 2022, homes in the United States remained on the market for an average of 37 days, which was more than a week longer than the 28-day average the previous year.
This marked the most significant year-over-year slowdown ever recorded, and December was the slowest month of the year for home sales.
- As of March 2023, the estimated number of new houses for sale in the United States was 432,000, which represented a slight decline from 436,000 at the end of February.
At the current sales rate, this equates to a supply of 7.6 months, indicating a decrease from the 8.2 months of supply in the previous month.
- Between 2012 and 2022, the US residential real estate market has experienced a shortage of 6.5 million homes due to a gap between single-family home constructions and household formations.
However, it's worth noting that this figure is an overstatement of the housing shortage since there are new multi-family home options available to buyers and renters.
- Between 2012 and 2022, approximately 15.6 million households and 13.3 million housing units were constructed in the United States.
Among them, 11.9 million were residential properties, including 9.03 million single-family houses and 4.2 million multi-family homes. However, only 8.5 million single-family homes and 3.4 million multi-family houses were completed during this period.
- In 2022, there were approximately 1 million single-family home starts.
This figure was 10.6% fewer than the previous year. While competition soared, the rate of overall housing starts eased up in 2022.
Best Real Estate Markets
In 2022, experts identified the best real estate markets for investors and home buyers, known as "hot markets." These cities experienced home value increases that exceeded national averages and analyst projections in the past year, indicating rising property values, home equity, and population growth. These markets offer affordability, job opportunities, and entertainment options, making them highly desirable. So, why are these cities considered the best real estate markets? Let's examine the statistics.
- Austin, Texas experienced a significant 4% increase in home value, resulting in a median listing price of $620,000, with properties remaining on the market for 46 days.
Known for its abundance of amenities and attractions, Austin offers a vibrant city life similar to that of New York, complemented by its warm weather. Notably, Austin has emerged as one of the top-performing major job markets since the onset of the pandemic.
As of April 2023, the median listing home price in Austin further rose to $635,000, representing a year-over-year increase of 4.3%. The median listing price per square foot stood at $356. These figures reflect the strong performance and continued growth of Austin's real estate market.
<table><thead><tr><th>City</th><th>Median Price</th><th>Time on Market</th><th>Home Value Increase (over pre-pandemic levels)</th></tr></thead><tbody><tr><td>Austin, Texas (Metro Area)</td><td>$620,000</td><td>46</td><td>4%</td></tr><tr><td>Tampa, Florida</td><td>$388,800</td><td>40</td><td>4%</td></tr><tr><td>Raleigh, North Carolina</td><td>$389,000</td><td>50</td><td>4%</td></tr><tr><td>Nashville, Tennessee (Metro Area)</td><td>$429,900</td><td>26</td><td>7%</td></tr><tr><td>Charlotte, North Carolina</td><td>$385,000</td><td>35</td><td>—</td></tr><tr><td>San Antonio, Texas</td><td>$285,000</td><td>55</td><td>—</td></tr><tr><td>Phoenix, Arizona</td><td>$459,000</td><td>35</td><td>30%</td></tr><tr><td>Jacksonville, Florida</td><td>$289,900</td><td>42</td><td>5%</td></tr><tr><td>Atlanta, Georgia</td><td>$400,000</td><td>41</td><td>—</td></tr><tr><td>Orlando, Florida</td><td>$350,000</td><td>39</td><td>—</td></tr></tbody></table>
- Tampa, Florida experienced a notable 4% increase in home values above pre-pandemic levels, resulting in a median listing price of $388,800, with properties staying on the market for an average of 40 days.
The city's remarkable job growth, which exceeded 84,000 since the beginning of 2021, has contributed to its popularity among prospective homeowners.
As of April 2023, the median listing price for homes in Tampa remained unchanged compared to the previous year, with a value of $400.4K. Additionally, the median home sold price stood at $410,000. These statistics indicate a relatively stable housing market in Tampa, suggesting a balanced environment for both buyers and sellers.
- In Raleigh, North Carolina, homes had an average time on the market of 50 days, while experiencing a 4% increase in home value.
The 'Triangle' region, which includes Raleigh, projects a population growth over the next 15 years, making it an enticing market. The presence of attractive, high-paying jobs in tech, science, and research further contributes to the region's appeal.
The median listing price for homes in the area was $389,000, with an April 4.3% year-over-year increase to $449,000. Additionally, the median listing price per square foot stood at $228.
- Nashville, Tennessee had a median listing price of $429,900.
Additionally, homes in Nashville have an average time on the market of 26 days and achieved a remarkable 7% increase in home value over pre-pandemic levels. The city has consistently ranked in the top 10 metro areas for both job opportunities and economic growth in recent years.
As of April 2023, the median listing home price in Nashville reached $513.1K, reflecting a notable year-over-year increase of 14%. Furthermore, the median listing price per square foot stood at $296. These figures highlight the upward trend and strong market performance in Nashville's real estate sector.
- Charlotte, North Carolina had a median listing price of $385,000, with properties typically staying on the market for 35 days.
One intriguing fact about Charlotte is its cost of living, which is 5% below the national average. Furthermore, the city's job growth is projected to increase by an impressive 45.2% over the next 10 years.
As of April 2023, the median listing home price in Charlotte reached $417.9K, experiencing a positive year-over-year increase of 4.5%. Additionally, the median listing price per square foot stood at $230, while the median home sold price was $418.5K. These figures reflect the strong real estate market in Charlotte, North Carolina.
- In San Antonio, Texas, the median listing price stood at $285,000, and the average time on the market was 55 days, indicating a buyer's market.
San Antonio is known for its range of fun activities, rich history, and abundant sunshine, with over 300 days of sunshine per year. Moreover, it is one of the fastest-growing metros in the country.
As of April 2023, the median listing price for homes in San Antonio experienced a year-over-year increase of 1.5%, reaching $304,000. Additionally, the median listing price per square foot was $171. These statistics highlight the ongoing growth and strength of San Antonio's housing market.
- In Phoenix, Arizona, the median listing price was $459,000, and homes typically stayed on the market for 35 days.
The city witnessed a significant 30% increase in home values above pre-pandemic levels, primarily driven by a sudden influx of homebuyers.
As of April this year, the median listing price for homes in Phoenix, Arizona remained steady compared to the previous year, staying at $475,000. The median listing price per square foot was $286, while the median home sold price was $420,000. These figures showcase the stability and attractiveness of Phoenix's real estate market.
- Jacksonville, Florida had a median listing price of $289,900, with an average of 42 days on the market for properties.
The city experienced a significant 5% increase in home values above pre-pandemic levels, and its cost of living is 5% below the national average. With a population of over one million residents, Jacksonville is among the fastest-growing economic areas in the U.S., largely due to its robust job growth.
As of April 2023, the median listing price for homes in Jacksonville witnessed a year-over-year increase of 1.6%, reaching $304,900. The median listing price per square foot was $190, while the median home sold price was valued at $292,000. These figures indicate a positive trend in Jacksonville's real estate market, offering opportunities for both buyers and sellers.
- Atlanta, Georgia had a median listing price of $400,000, demonstrating continuous yearly growth in its real estate market.
Properties in Atlanta typically stayed on the market for an average duration of 41 days, while the city's cost of living was 1% below the national average. The economic and cultural prominence of Atlanta attracts an increasing number of individuals to the city, offering a range of job opportunities in sectors such as finance, healthcare, and real estate.
As of April 2023, the median listing home price in Atlanta further increased by 1.3% year-over-year, reaching $414,900. The median listing price per square foot stood at $268, and the median home selling price reached $405,000. These figures exemplify the ongoing growth and demand in Atlanta's real estate market, solidifying its appeal for prospective homebuyers and investors.
Trends by State
The competition had been fueling the increases in housing market prices over the years. There had been various changes that significantly influenced the status of the U.S. residential real estate market. However, it remains evident that some states consistently outperform others, particularly in terms of new construction, median home prices, and other indicators that reflect the overall health of the housing market. Read on to see the residential real estate market trends by state as of March 2023:
- In 2023, home prices in New York experienced a decline of 3.9% compared to the previous year.
The city had a median price of $785,000. Properties in New York stayed on the market for an average of 94 days, representing an increase in market stay duration compared to 74 days in 2022. It is important to note that the number of homes sold in March was 2,392, indicating a decrease from 3,830 homes sold during the same period last year. These statistics reflect the dynamics of the real estate market in New York, showcasing fluctuations in pricing and market activity.
- In March 2023, home prices in Georgia experienced a slight increase of 0.3% compared to last year.
The median price for homes in the state was $346,700. However, the number of homes sold was down by 21.4% year-over-year on average. In March of this year, a total of 12,020 homes were sold, representing a decrease from 15,296 homes sold during the same month last year. The market stay duration, or the average time properties stayed on the market, was 44 days, which increased by 24 days compared to the previous year. These figures indicate some shifts in the Georgia real estate market, including a moderate increase in home prices but a decline in the number of homes sold.
- In March 2023, home prices in Virginia experienced a decline of 2.5% compared to the previous year.
The median price for homes in the state was $398,100. The number of residential properties sold on average was down by 22.5% year-over-year, with 9,355 homes sold compared to 12,074 homes sold in March of the previous year. Additionally, the average number of days that properties stayed on the market was 29, which represented a 10-day increase compared to the previous year. These figures indicate a decrease in home prices and a decline in the number of homes sold in the Virginia real estate market, with properties taking slightly longer to sell compared to the previous year.
- In March 2023, home prices in Washington experienced a significant decline of 7.0% compared to the previous year.
The median price for homes in the state was $586,100. Additionally, there was a notable decrease in the number of homes sold, with a decline of 32.3% year-over-year. In comparison to the 10,814 homes sold in March of the previous year, this year saw only 7,327 homes sold. Furthermore, the median number of days that properties stayed on the market was 25, which represented an increase of 16 days compared to the previous year. These figures indicate a significant drop in home prices, a decline in the number of homes sold, and an increase in the average duration that properties stayed on the market in Washington.
- In March 2023, the real estate market in Arizona experienced a decline in the number of homes sold, with an average drop of 27.3% year-over-year.
The median price for homes in the state also declined by 7.4% compared to the previous year, reaching $416,600. In terms of home sales, this year saw 9,649 homes sold, which is a decrease from the 13,277 homes sold in March of the previous year. Additionally, the median number of days that properties stayed on the market increased to 58 days, representing a 30-day increase compared to the previous year. These statistics indicate a decrease in both home prices and the number of homes sold in the Arizona real estate market in March 2023, along with an increase in the average duration that properties stayed on the market.
- In 2023, the median home price in California was $742,800, representing a 7.9% decrease compared to the previous year.
The real estate market in California also experienced a significant drop in the number of homes sold, with an average decline of 33.2% year-over-year. Specifically, in March of this year, there were 24,000 homes sold, which is a decrease from the 35,950 homes sold in the same month last year. These figures indicate a decrease in both home prices and the number of homes sold in the California real estate market in 2023.
- As of March 2023, the median price of properties in Texas experienced a year-over-year decrease of 2.5% to $341,300.
The number of homes sold in Texas also declined by 14.1%, with 28,466 units sold compared to 33,131 units sold in March 2022. Additionally, the average duration that properties stayed on the market increased by 29 days from the previous year, with an average of 51 days on the market. These statistics suggest a decrease in home prices and the number of homes sold in the Texas real estate market in March 2023.
- In Florida, home prices experienced an increase of 3.2% compared to the previous year.
The median price for homes sold in Florida was $400,200. However, the average number of homes sold dropped by 18.1% year-over-year, with 38,312 homes sold in March this year compared to 46,801 homes sold in the same month last year. The median duration that properties stayed on the market in Florida was 49 days. These statistics indicate a rise in home prices but a decrease in the number of homes sold in the Florida real estate market in March.
- In 2023, Ohio's median home price increased by 4.0% to $217,600 compared to the previous year.
This indicates a rise in home prices in the Ohio real estate market. However, the average number of home sales experienced a year-over-year drop of 8.1%. In March, 10,725 homes were sold in Ohio, down from 11,664 homes sold in the same month the previous year. Despite the decrease in home sales, the increase in median home price suggests positive growth in the Ohio real estate market.
- In Alaska, home prices saw an increase of 4.8% compared to the previous year.
The median price of homes in Alaska was $350,600, indicating a rise in home values. However, there was a significant decline in the average number of homes sold, with a decrease of 29.1% compared to the previous year. In March, there were 499 home sales in Alaska, down from 704 homes sold in the same month the previous year. Despite the decline in the number of homes sold, the increase in home prices suggests a positive market trend in terms of value appreciation.
- In Hawaii, home prices showed a modest increase of 2.1% in 2023 compared to the previous year.
The median price of homes sold in Hawaii reached $730,200, reflecting the continued demand and appreciation in the housing market. However, there was a significant decline in the average number of homes sold, with a drop of 32.3% year-over-year. In March, only 1,132 homes were sold in Hawaii, down from 1,672 homes sold in the same month the previous year. Additionally, the number of days that properties stayed on the market increased by 26, indicating a slightly slower pace of sales compared to the previous year. This suggests that the market may have experienced a slowdown or decreased buyer activity, resulting in a longer time for properties to be sold.
Competitive Landscape
Real estate brokerages and housing companies play a significant role in the real estate industry. These trusted brands provide guidance and assistance to customers, helping them navigate the complexities of the market and make successful investments. Even during extraordinary events like the recent pandemic, these professionals have adapted to the changing needs and preferences of homebuyers, ensuring that their clients' requirements are met effectively. Here are some insights we've collected about the top U.S. residential real estate companies:
- During the first quarter of 2023, Coldwell Banker Real Estate achieved an impressive sales volume of over $3.2 billion in the domestic market.
This success can be attributed to the company's efficient renewal and succession strategy, which helped them retain 25 affiliated domestic companies. These retained companies played a significant role in contributing to the Q1 sales volume. With a network of 3,000 agents, Coldwell Banker currently holds the distinction of being the largest real estate company in the United States. This demonstrates their strong presence and influence in the industry.
- In the first quarter of 2023, RE/MAX Holdings reported a total revenue of $85.4 million and an adjusted EBITDA of $19.9 million.
As a leading real estate company in the United States, RE/MAX has maintained its position in the industry through its extensive experience and expertise. The company has a global presence, with approximately 100,100 agents and 7,000 offices worldwide. This expansive network allows RE/MAX to provide real estate services to clients across various markets. With its strong revenue and global reach, RE/MAX continues to be a major player in the real estate industry.
- Keller Williams Realty achieved remarkable success in the first quarter of this year, with a significant sales volume of $4.0 billion.
During this period, Keller Williams agents completed an impressive 19,000 transactions, highlighting their productivity and expertise. One of the factors contributing to Keller Williams Realty's success is its unique 70/30 model. This model ensures that 70% of the commissions earned go to the agents, while the remaining 30% is allocated to the brokerage. This approach provides a favorable compensation structure for agents, incentivizing their performance and fostering a strong sense of motivation within the company.
- As of March 2023, eXp Realty reported having cash and cash equivalents totaling $122.8 million.
This represents a decrease from the $130.1 million they had in the same period last year. It is worth noting that eXp Realty achieved a substantial revenue of $850.6 million and a gross profit of $73.1 million. eXp has one of the biggest physical land spaces in the U.S. and is known for its sales and customer satisfaction. eXp Realty's financial performance and unique business model position it as a significant player in the real estate industry.
- In the first quarter of 2023, agents from Compass closed a total of 35,886 transactions.
Although this number represented a 24% decrease compared to the same period in 2022, it is important to note that the entire U.S. residential real estate market experienced a 26% decline in transactions during this time. Despite the decline in transaction volume, Compass managed to achieve approximately $100 billion in sales. This success can be attributed to their emphasis on prioritizing the needs of the consumer rather than focusing solely on the interests of the seller.
- As of May 2023, Realogy has a market capitalization of $1.44 billion.
The company's current revenue stands at $7.90 billion, which shows a slight increase compared to the revenue of $7.81 billion in 2021. In terms of earnings, Realogy has reported $0.63 billion in current earnings, representing a growth from $0.62 billion in 2021 and a significant increase from $0.35 billion in 2020. These figures indicate that Realogy has been able to maintain stable revenue and improve its earnings over the past few years.
- Cushman & Wakefield's market capitalization is $1.75 billion.
The company reported a revenue of $10.02 billion in the current year, showing an increase from the previous year's revenue of $9.38 billion. Additionally, the company's earnings for the current year are $0.37 billion, which represents a decrease from the earnings of $0.50 billion in 2022.
- Simon Property Group (SPG) reported a revenue of $5.34 billion in 2023.
This represents a slight increase from the previous year's revenue of $5.29 billion and an increase from the revenue of $5.11 billion in 2021. As of May this year, the market capitalization value of Simon Property Group is $40.09 billion. Furthermore, the company's earnings for the current year are reported as $3.33 billion, showing a slight increase from the earnings of $3.29 billion in 2022.
- Essex Property Trust (ESS) has a market capitalization value of $13.74 billion.
The company's current revenue for the given year is reported as $1.63 billion, showing a slight increase from the previous year's revenue of $1.60 billion. In terms of earnings, Essex Property Trust (ESS) achieved $0.70 billion in 2023, which marks an improvement from 2022's $0.61 billion but is slightly lower than the earnings of $0.72 billion in 2021.
- CoStar Group (CSGP) has a market capitalization value of $31.66 billion.
The company's current revenue is reported as $2.25 billion, representing an increase from the previous year's revenue of $2.18 billion. However, the earnings for this year are reported as $0.39 billion, which is a decrease from 2022's earnings of $0.45 billion.
- As of May 2023, Redfin has a market capitalization value of $1.20 billion.
The company's current revenue is reported as $2.01 billion, which indicates a decrease from the previous year's revenue of $2.28 billion. In 2021, the company's revenue was $1.92 billion. However, it's important to note that the earnings for this year are reported as -$0.33 billion, indicating a loss, and a decrease from 2021's earnings of -$0.12 billion.
- As of May 2023, Camden Property Trust (CPT) has a market capitalization value of $11.82 billion.
The company's current revenue is reported as $1.48 billion, indicating a significant increase from the previous year's revenue of $1.14 billion. While the earnings for 2023 are slightly lower at $0.62 billion compared to $0.66 billion in 2022, it is important to note the substantial growth from 2021 when the earnings were only $0.31 billion.
- Zillow has a market capitalization of $10.54 billion.
The company's current revenue is reported as $2.39 billion, which is a significant decrease from the revenue of $6.18 billion in 2022. As for earnings, in 2023, Zillow has a negative earnings figure of -$0.13 billion. Comparatively, in 2022, the earnings were -$95 million, and in 2021, they were -$0.53 billion.
Forecast 2025
To ascertain housing market trends, experts rely on forecasts of the residential real estate market in the United States. Nevertheless, it's important to note that changes and uncertainties in the global market can also impact the success of America's housing industry. Let's examine what industry experts predict for the residential real estate market in 2025:
- Transaction volumes for residential real estate sales are projected to reach 5.1 million in 2023.
However, this projection is lower than the peak of nearly 7 million home sales recorded in the U.S. in 2021. It's worth noting that the projection may be influenced by factors such as record-high increases, potentially driven by inflation. Furthermore, it's important to mention that the average sales prices of new homes have been on the rise since 2011. - The number of existing home sales is projected to decline by 16% in 2024 compared to 2023.
This means that this year's sales may reach approximately 4.3 million homes. Prospective buyers could face affordability challenges, including persistently high home prices, elevated mortgage rates, and the potential impact of a recession.
<table><thead><tr><th>Rank</th><th>U.S. metro area</th></tr></thead><tbody><tr><td>1</td><td>Lake County, IL</td></tr><tr><td>2</td><td>Chicago, IL</td></tr><tr><td>3</td><td>Milwaukee, WI</td></tr><tr><td>4</td><td>Albany, NY</td></tr><tr><td>5</td><td>Baltimore, MD</td></tr><tr><td>6</td><td>Elgin, IL</td></tr><tr><td>7</td><td>Rochester, NY</td></tr><tr><td>8</td><td>Pittsburgh, PA</td></tr><tr><td>9</td><td>New Haven, CT</td></tr><tr><td>10</td><td>Hartford, CT</td></tr></tbody></table>
- Sales of newly built homes are expected to experience a significant decline of 20%, reaching approximately 500,000 sales across the U.S.
Similarly, existing home sales are projected to decrease by 31% year-over-year. In 2021, despite the homebuying boom triggered by the pandemic, home sales dropped by 30%. Furthermore, housing turnover is anticipated to hit a record low this year, with only 32 out of every 1,000 households selling their homes.
- If inflation continues to persist, there is a possibility of sales declining by up to 27% year-over-year.
In a potential existing sales scenario, there could be a 12% drop from 2022, resulting in just over 4.5 million sales this year. This outcome is more likely if inflation slows down at a faster and consistent pace than initially anticipated.
- By the yearend, there is expected to be a decrease in mortgage rates to below 6%.
Specifically, when considering 30-year fixed mortgage rates, a gradual decline to approximately 5.8% is anticipated by the end of the year. The average homebuyer rate is projected to hover around 6.1%
- Projections indicate that the median home-sale price could experience a decline of approximately 4% to $368,000, marking the first annual drop since 2012.
This decline may be attributed to higher interest rates and the final sale prices reflecting contracts made in 2022. It is important to note that a continuous decrease in new listings is expected, which could keep the total inventory near historic lows and potentially prevent a significant price drop.
- Year-over-year drops of roughly 25% may fall on building permits and housing.
Builders are expected to reduce their construction of new homes, particularly new single-family homes. It is worth noting that, for builders, there may be a greater financial incentive to focus on constructing rental units this year.
- It is projected that real estate investors will purchase approximately 25% fewer homes compared to the previous year.
Additionally, listing activity from investors is expected to be lower compared to the previous year, although not to the same extent as new listings in the overall market. This is because some investors may have a need to sell off inventory following their buying sprees over the last two years.
- Experts predict that the migration rate of Americans moving from one metro area to another will likely decrease to approximately 20% in 2024, marking a decline from the 24% observed in 2023.
Despite the drop, this percentage remains higher than the pre-pandemic levels of around 18%. Relocation continues to be a common practice, particularly among retirees and remote workers seeking more affordable areas to reside in.
Conclusion
Despite high-interest rates, there has been a decline in prices across the U.S. housing market in mid-2022. However, experts suggest that a sudden and abrupt crash is unlikely, basing their opinion on the current market conditions. It is important to consider various factors such as mortgage interest rates, unemployment levels, and supply and demand dynamics, which all contribute to the performance of the U.S. residential market. While some markets have experienced declines, others have shown growth. It is worth mentioning that these declines are not significant enough to trigger a housing market crash.
FAQs
What is the current state of the real estate market in the United States?
Currently, the residential real estate market in the U.S. is valued at $2.48 billion. A year after the pandemic, the industry quickly bounced back and experienced a strong seller’s market. Its prices in a number of areas are driven by high demand and low inventory. The trend endured into 2022, with more and more people in search of larger homes as an after-effect of the pandemic’s requirement for remote work and social distancing.
Is the real estate industry growing or declining?
Since 2022, the American residential real estate industry has been growing due to ascending demand and low inventory, which ended up fueling prices in many areas. This trend has persisted into 2022 and may still be ongoing.
However, it's worth noting that the residential real estate market can be cyclical and can experience periods of both growth and decline. While the market has been strong in recent years, the U.S. residential real estate market is susceptible to various risks and uncertainties.
What are the statistics for home buying in the US?
The proportion of households owning their own property rose slightly in 2022, with homeownership standing at 65.9%. Experts predict that in 2024, the homeownership rate will increase by 0.4%, reaching 65.6%. It's worth noting that some studies have suggested that homeownership may have a positive impact on household wealth and stability.
How big is the US residential real estate market?
The US residential real estate market plays a vital role in the country's economy, with a significant contribution to various industries. The construction industry, for instance, heavily relies on the residential real estate market for demand and growth. The mortgage lending industry, on the other hand, provides financing for home purchases, which fuels the residential real estate market. Additionally, home improvement and renovation industries benefit from the residential real estate market as homeowners often invest in enhancing their properties.
As of now, the US residential real estate market has 4.8 million existing home sales, which indicates a healthy demand for homes. In 2021, residential real estate dominated the market, accounting for 35.5% of the overall revenue share of the housing industry. This highlights the market's importance and its significant contribution to the overall economy.
What percent of the US economy is real estate?
The real estate industry is a crucial component of the US economy, contributing significantly to various sectors such as construction, finance, and home improvement. While the exact percentage of the economy represented by the industry can vary depending on how it's measured, data from the Bureau of Economic Analysis shows that real estate, rental, and leasing activities accounted for around 5.9% of the US gross domestic product (GDP) in 2020. This includes a range of activities, from buying, selling, and renting properties to property management, leasing, and related services.
Furthermore, the real estate industry's indirect effects on other sectors of the economy can further increase its overall economic contribution. For instance, strong real estate demand can create job opportunities and boost construction and home improvement activities, which, in turn, stimulate further economic growth. However, the industry's contribution to the economy can be influenced by various factors, such as interest rates, demographic trends, and economic conditions, leading to fluctuations in its performance over time.
What percentage of US homes are investment properties?
In September 2021, the real estate sector accounted for approximately 13% of the US economy. The sector covers a vast range of activities, including residential and commercial real estate activities like construction, sales, leasing, and property management.
What percentage of Americans have a home without a mortgage?
In September 2021, the US Census Bureau released data indicating that around 37% of households in the United States owned their homes outright, without any mortgage or housing-related debt. This figure highlights the number of households who have paid off their mortgages or purchased their homes outright, giving them complete ownership of their properties.
What states have the hottest real estate markets?
The hottest real estate market in 2024 is Worcester, Massachusetts. From its November 2022 median home price of $447,000, it has a forecasted home price change of +10.6% this year. The second strongest U.S. residential real estate market is Chattanooga, Tennessee-Georgia, with a median home price of $397,000 in November 2022. Its forecasted 2023 home price change is +8.2%. Hartford-West Hartford, Connecticut had a median home price of $372,000 in November 2022 and a forecasted 2023 home sales change of +6.5%.
What state has the highest ROI for buying a house?
As of 2022, the state with the highest ROI for purchasing a house was Arizona, with 27.42%. It had the highest one-year ROI on residential single-family homes. It was followed by Uta with 27.05% and Idaho with 27.02%.
What is the fastest-growing real estate market in the United States?
As of 2021, Idaho reached the top of the list of the fastest-growing real estate markets in the United States. In terms of population growth from 2010 to 2020, its growth rate was 37.5%. This rapid population boom produced increased demand for housing in the state.
What type of real estate has the highest return?
While identifying what type of real estate has the highest return may depend on various factors, such as location, certain property specifications, and market conditions, it is commercial real estate that is known to generate higher returns compared to residential real estate.
Sources
- census.gov
- redfin.com
- realtor.com
- nar.realtor
- attomdata.com
- attomdata.com
- buildium.com
- mordorintelligence.com
- coldwellbanker.com
- propertyshark.com
- statista.com
- rocketmortgage.com
- remax.com
- kw.com
- exprealty.com
- investors.compass.com
- companiesmarketcap.com
- ibisworld.com
- grandviewresearch.com
- usatoday.com