


The mortgage industry plays a vital role in U.S. housing and the broader economy. Tracking key mortgage statistics provides insights into lending activity, borrower access to credit, housing market conditions, and risks. This overview analyzes critical metrics on lending volumes, borrower demographics, interest rates, delinquencies, and more to highlight crucial trends. These data spotlight mortgage availability, affordability, and performance.
Key Takeaways
- Mortgage lending volumes decreased in 2022 but remained elevated historically (8.4 million originations, down from 10.1 million) (CFPB)
- Refinance lending fell sharply, down 72.8% year-over-year (CFPB)
- Purchase lending decreased 19.1% from 2021 but is still robust (1.6 million purchased loans) (CFPB)
- The share of mortgages to Black borrowers increased to 8.1%. Denial rates are higher for Black and Hispanic applicants (CFPB)
- Median credit score on new mortgages declined to 766 but remains tight (Q4 2022) (Federal Reserve Bank of New York)
- Mortgage delinquencies decreased to 3.56%, a post-crisis low (Q1 2023) (Mortgage Bankers Association)
- Serious delinquencies down to 1.73% (Q1 2023) (Mortgage Bankers Association)
- Foreclosure starts increased 23% year-over-year (February 2023) (ATTOM)
- Average 30-year fixed rate forecast at 6.8% for Q3 2023 (Fannie Mae)
- House price appreciation forecast revised to -1.2% growth for 2023 (Fannie Mae)
- Real GDP growth forecast lowered to -0.4% for 2023 (Fannie Mae)
- Unemployment rate is forecast to rise to 4.4% by the end of 2023 (Fannie Mae)
Housing Market Activity
Within the wider mortgage statistics landscape, key housing market metrics provide crucial demand-side insights. Home sales volumes, inventory levels, and building permits outline availability and interest on the buyer front. These real estate consumption statistics, alongside prevailing economic growth, employment, and inflation data, compose a demand picture amid broader monetary conditions. For mortgage lending and performance, housing market activity stats contextualize the consumer backdrop for mortgage borrowing, affordability, and residential investment.
Home Sales Volume
Housing market activity is typically measured by tracking home sales volume, providing insight into real estate demand. Key metrics like existing home sales, new home sales, and regional trends paint a picture of current conditions and direction in the home buying market.
- Existing home sales declined 19% from a year ago as of June 2023
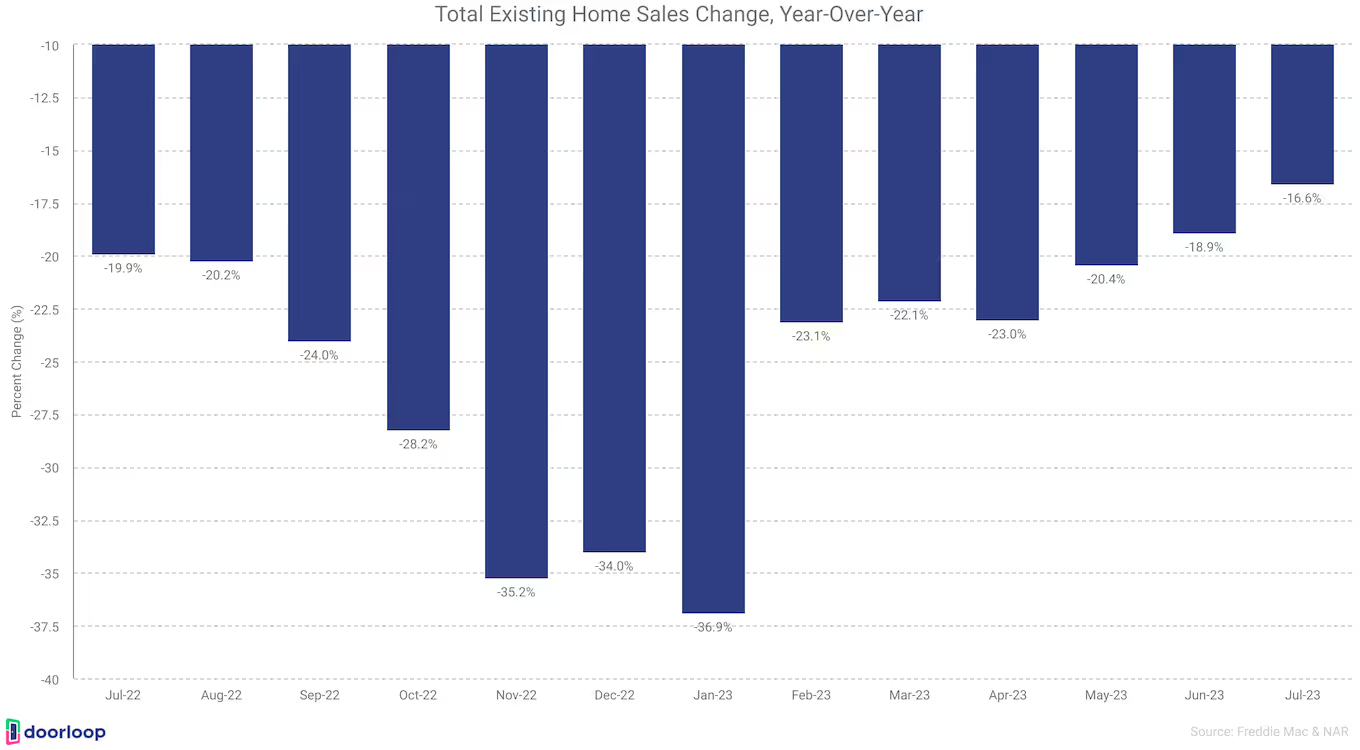
- New home sales were up 23.8% year-over-year as of June 2023
Housing Inventory
The inventory of homes available for sale is a crucial indicator of supply in the housing market. Key statistics like the total number of existing homes for sale, months' supply of inventory, and new home inventory represent how much availability exists to meet buyer demand.
- The inventory of existing homes for sale was 1.08 million units in June 2023, down 13.6% from a year ago.
- The months' supply of existing homes for sale was 3.1 months in June 2023.
- The inventory of new homes for sale was 432,000 in June 2023, representing 7.4 months' supply.
- The Freddie Mac House Price Index increased 0.7% month-over-month and 1.7% year-over-year in June 2023.
Housing Starts and Permits
Housing starts and permits offer a leading outlook on new residential construction activity. The volume of housing starts and permit authorizations indicates builder confidence and future home supply, providing insights before the new homes reach the market.
- Housing permits in June 2022 were at a seasonally adjusted annual rate of 1.44 million, down 3.7% from May 2022 and 15.3% below June 2021. This indicates slowing permit activity.
- Single-family permits specifically were 922,000 in June 2022, up 2.2% from May but still likely down from the previous June.
- Housing starts in June 2022 were at a rate of 1.434 million, down 8% from May 2022 and 8.1% below June 2021. This points to declining housing construction start.
- Single-family housing starts in June were at a rate of 935,000, down 7% from May. So single-family starts are slowing.
- Single-family completions were 986,000 in June, down 2.8% from May but likely above the prior June.
Economic Factors and Inflation
Broader economic conditions and inflation shape the landscape for mortgage lending and the housing sector. Key indicators like GDP growth, unemployment, wage growth, and the inflation rate help provide macroeconomic context surrounding factors affecting homebuyer demand, affordability, and mortgage credit availability.
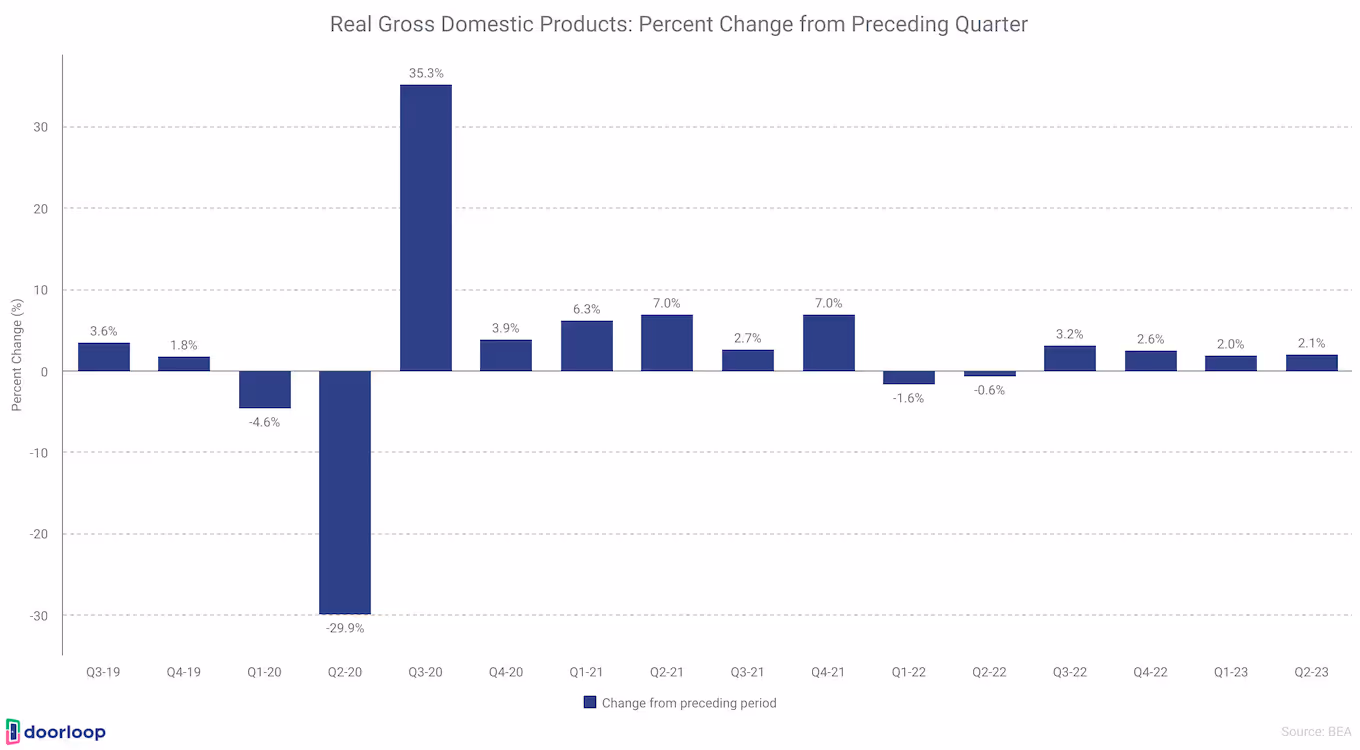
- GDP grew at an annualized rate of 2.1% in Q2 2023, up from 2.0% in Q1 2023.
- 187,000 jobs were added in July 2023, less than the expected 200,000.
- The unemployment rate ticked down to 3.5% in July 2023.
- In July, average hourly earnings for all employees on private non-farm payrolls rose by 14 cents, or 0.4 percent, to $33.74.
- Over the past 12 months, average hourly earnings have increased by 4.4 percent.
- In July, average hourly earnings of private-sector production and nonsupervisory employees rose by 13 cents, or 0.5 percent, to $28.96.
- Inflation measured by Core PCE (personal consumption expenditures) was 4.1% year-over-year in June 2023.
- Personal income increased $69.5 billion (0.3 percent at a monthly rate) in June.
- Prices for goods increased 0.1% month-over-month while prices for services increased 0.3% month-over-month in June 2023.
Mortgage Market Size
The overall mortgage market size, measured by total outstanding mortgage debt, reflects the scale of residential lending activity. Mortgage origination dollar volumes annually also quantify lending levels from new loans. These market sizing metrics contextualize mortgage borrowing and issuance trends within the broader economy.
- Total mortgage debt outstanding reached $19.9 trillion in Q2 2023, up from $19.0 trillion in Q2 2022.
- Mortgage lending activity cooled in Q4 2022, with $498 billion in newly originated mortgage debt during the quarter. This volume marks a return to pre-pandemic levels after two years of extraordinarily high mortgage origination volumes fueled by low interest rates and refinancing demand.
- While national foreclosure moratoria have ended, new foreclosures remain muted in the wake of the CARES Act protections. Only about 34,000 individuals saw new foreclosure notations added to their credit reports in Q4 2022, indicating foreclosure starts are still depressed.
Mortgage Interest Rates
Mortgage interest rates are a primary factor influencing both homebuying activity and refinance demand.
The average 30-year fixed mortgage rate is a benchmark that impacts affordability and drives rate-sensitive borrowing. Tracking historical rate trends and expert forecasts provides insights into where rates are headed in the near term. Additionally, analyzing rate spreads across loan types illustrates pricing dynamics, as wider spreads indicate higher risk pricing for certain loans.
As a key component in home financing costs, prevailing mortgage rates and anticipated rate movements hold a major influence over the health of the housing market.
Average 30-year Fixed Rate
The average 30-year fixed mortgage rate is one of the most closely watched interest rate benchmarks, providing a standard for longer-term home financing costs. Historical trends and fluctuations in the prevailing average 30-year fixed rate illustrate the dynamics of mortgage affordability and lending over time.
- Over the first 5 years of a mortgage, an interest rate of 8.125% costs $14,747 more than an interest rate of 6.5%, according to data.
- Over the full 30-year term of a mortgage, an interest rate of 8.125% costs $71,558 more than an interest rate of 6.5%.
Rate Forecasts
Expert projections for where mortgage rates are headed offer valuable insights into expected loan costs and borrowing conditions. Rate forecasts from economists look at factors like inflation, employment, and monetary policy to predict if rates will rise, fall, or remain steady in the near future.
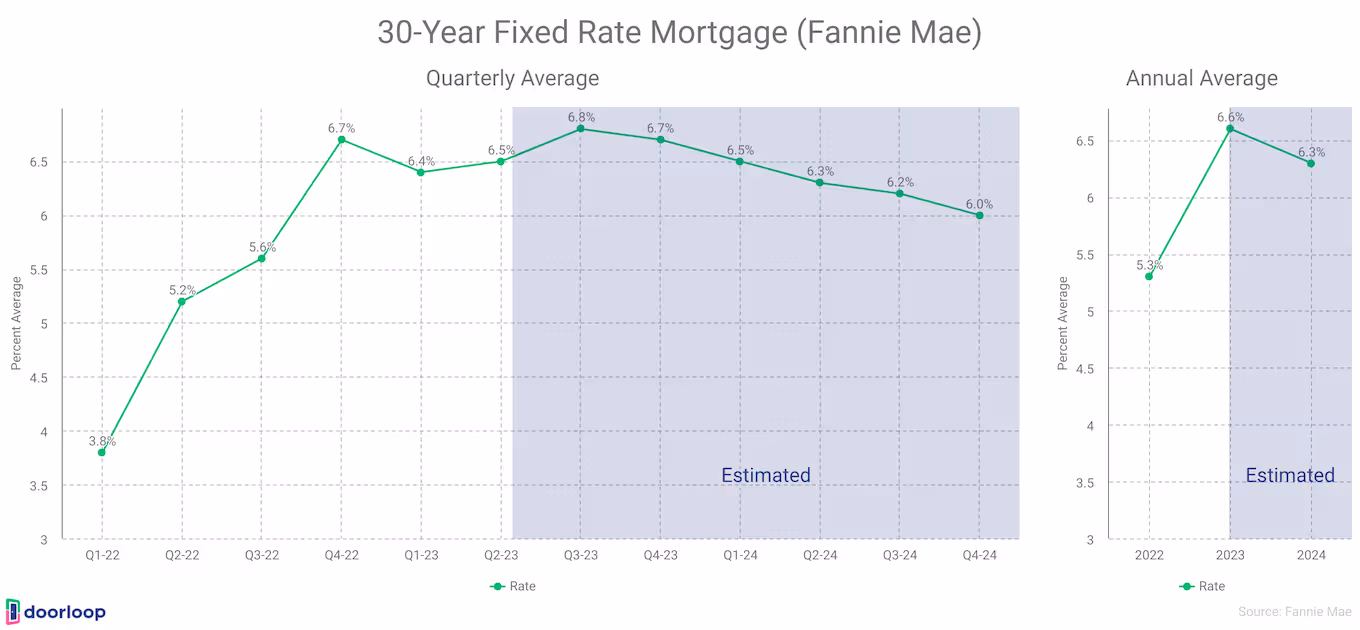
- According to Fannie Mae's housing forecast from August 2023, mortgage rates are expected to stay high but could go down a little in the next couple of years. Their forecast says average 30-year fixed mortgage rates will be around 6.8% during the third quarter of 2023. Rates might drop to about 6.7% by the end of 2023. They don't think rates will fall below 6% until the last 3 months of 2024. Overall, Fannie Mae predicts 30-year mortgage rates will average 6.6% in 2023 and 6.3% in 2024 before starting to decrease. So rates are still forecast to be a lot higher than historic averages over the next year and a half.
- For the National Association of Realtors (NAR)’s housing market outlook, mortgage rates are predicted to decrease to 6.4% by the end of 2022. NAR forecasts rates will further decline to 6% in 2024. The trade association expects rates to moderate from current highs but remain elevated above historic averages over the next 18 months.
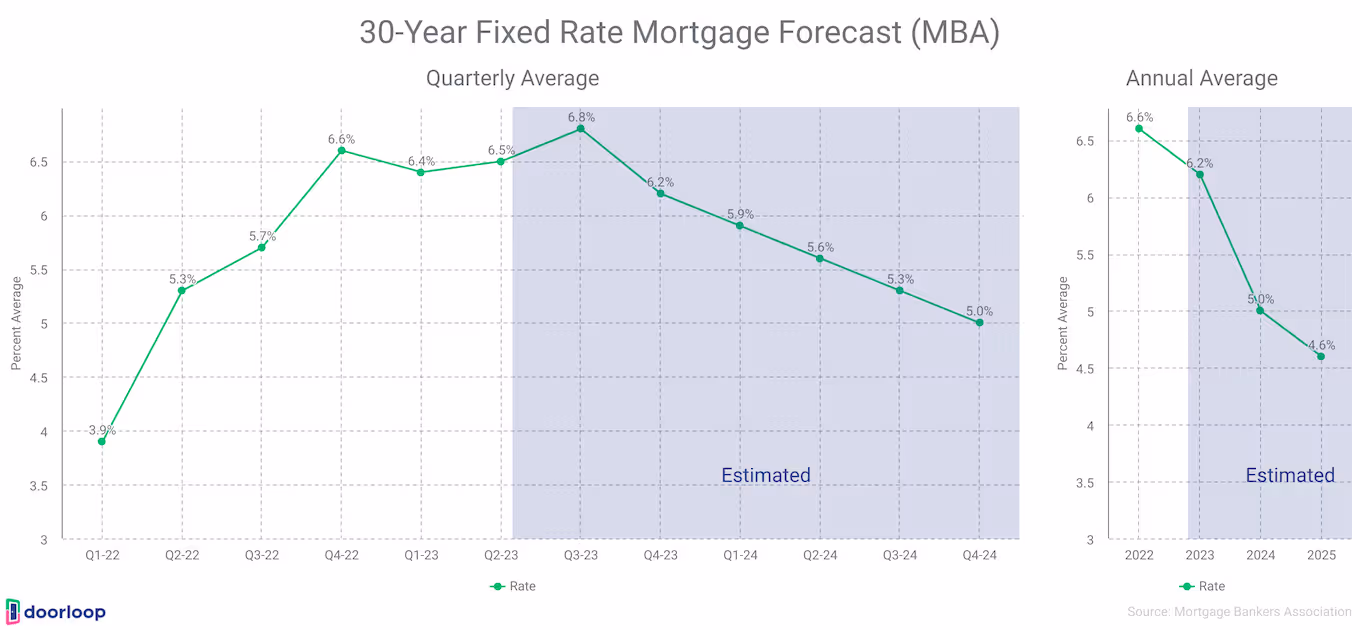
- The Mortgage Bankers Association (MBA) offered a more positive rate outlook in their August 2023 Mortgage Finance Forecast. They predict the 30-year mortgage rate will decrease to 6.2% by the end of 2023. The MBA forecast shows rates improving further in 2024, with projections that rates will dip below 5% in the fourth quarter of that year. Overall, the MBA expects declining rates following 2023, in contrast to other predictions of rates remaining stuck at high levels.
Below are some related forecasts from mortgage giant Fannie Mei from their Housing and economic outlook.
- The real GDP growth forecast was revised to -0.4% for 2023 on a Q4/Q4 basis, down from -0.3% previously.
- Real GDP growth forecast upgraded to 1.4% for 2024, from 1.2% previously. (Source: Fannie Mae)
- The unemployment rate is forecast to rise to 4.4% by the end of 2023 and 5.4% by the end of 2024.
- Headline CPI inflation forecast at 3.3% for 2023 and core CPI at 3.9% for 2023 on an annual basis.
- House price forecast revised to -1.2% growth for 2023 on a Q4/Q4 basis, improved from -4.2% previously.
- House price forecast of -2.2% for 2024, compared to -2.3% previously. (Source: Fannie Mae)
- Total home sales forecast upgraded to 4.84 million for 2023, from 4.63 million previously.
- Mortgage origination forecast increased to $1.66 trillion for 2023, from $1.55 trillion previously.
Mortgage Performance
Mortgage performance metrics gauge the health of outstanding loans through delinquency, default, and foreclosure trends. Tracking these negative outcomes help identify emerging risks and struggling borrowers. While mortgage performance has improved significantly since the housing crisis, ongoing monitoring remains vital to ensure mortgage credit quality.
Delinquencies and Foreclosures
Mortgage delinquencies and foreclosures indicate distress in the lending marketplace and harm to borrower finances. Tracking metrics like delinquency rates by loan type and geographic area provides insights into emerging risks.
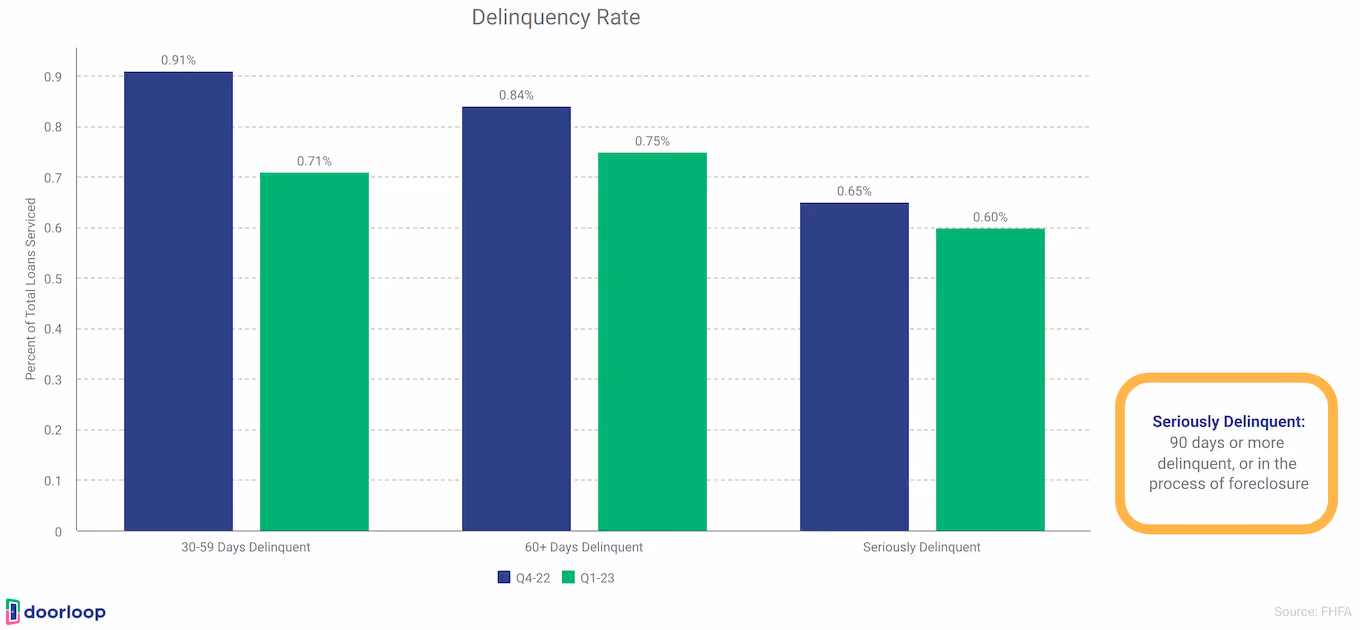
- According to the Federal Housing Finance Agency, the delinquency rate for 30-59 days delinquent loans for the Enterprises (Fannie Mae and Freddie Mac) was 0.71% at the end of Q1 2023.
- The delinquency rate for 60+ days of delinquent loans for the Enterprises was 0.75% at the end of Q1 2023.
- The serious delinquency rate for the Enterprises was 0.60% at the end of Q1 2023, the lowest level since the pandemic.
- In comparison, the serious delinquency rate was 4.01% for FHA loans, 2.26% for VA loans, and 1.73% for all loans (industry average) at the end of Q1 2023.
- The mortgage delinquency rate decreased to 3.56% in Q1 2023, down 40 basis points from Q4 2022 and 55 basis points from Q1 2022.
- The 30-day delinquency rate decreased to 1.77%, the 60-day rate decreased to 0.55%, and the 90-day rate decreased to 1.24% in Q1 2023.
- The total delinquency rate for conventional loans decreased 34 basis points to 2.44% in Q1 2023 versus Q4 2022.
- The seriously delinquent rate decreased to 1.73% in Q1 2023, down 16 basis points from Q4 2022 and 66 basis points from Q1 2022.
- Aggregate delinquency rates decreased in Q4 2022 but remain low at 2.5%.
- Delinquencies decreased by 59 basis points for conventional loans, 31 basis points for FHA loans, and 88 basis points for VA loans year-over-year.
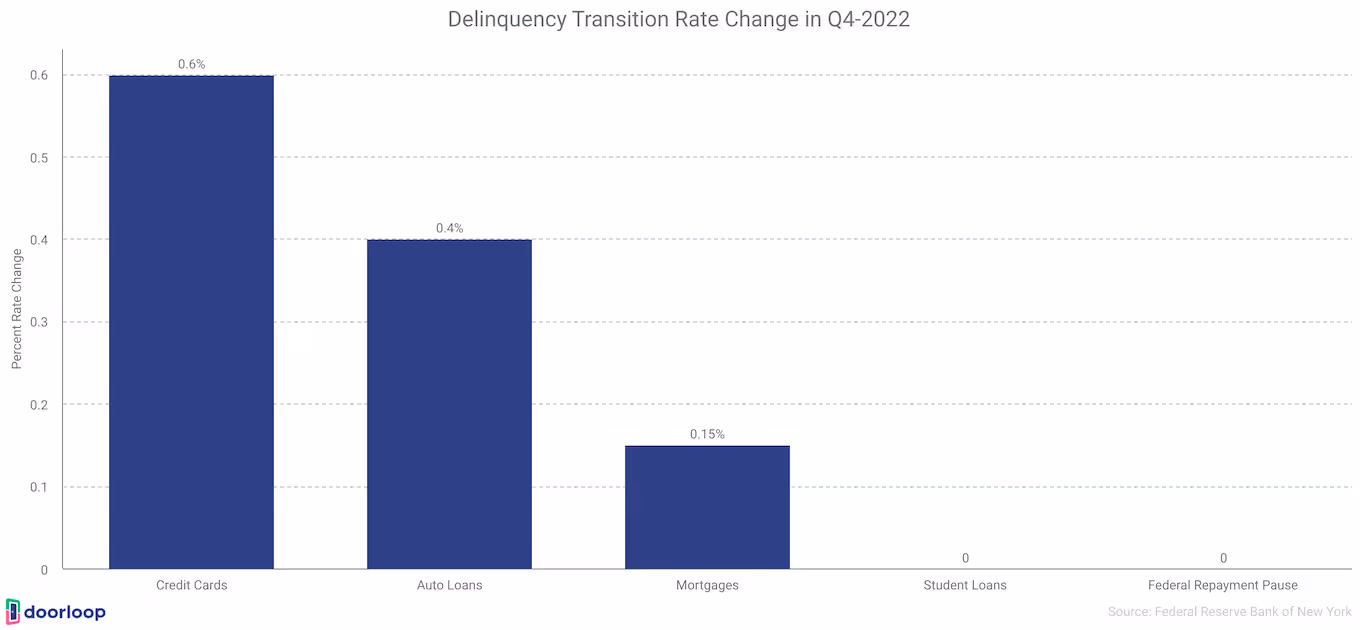
- Delinquency transition rates increased for credit cards, auto loans, and mortgages in Q4 2022.
- The FHA delinquency rate decreased 134 basis points to 9.27%, and the VA delinquency rate decreased 18 basis points to 3.98% in Q1 2023 versus Q4 2022.
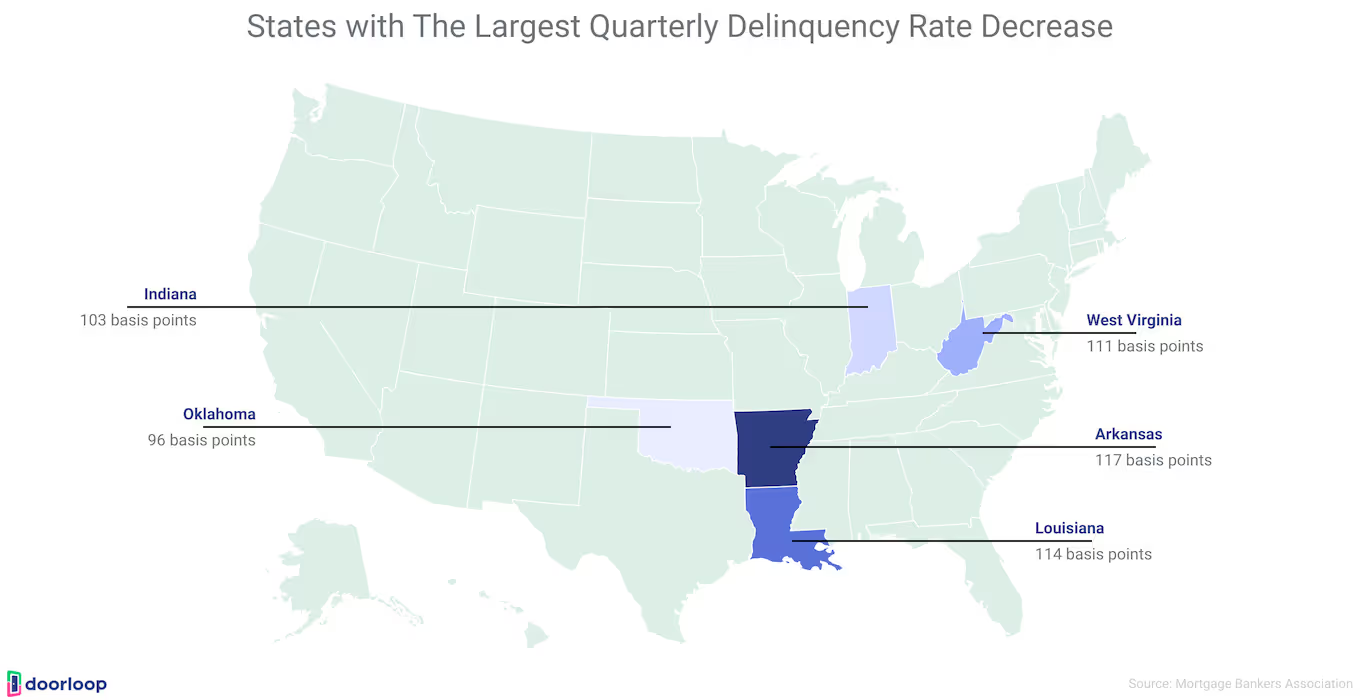
- Arkansas, Louisiana, West Virginia, Indiana, and Oklahoma saw the largest delinquency rate decreases quarterly.
Mortgage foreclosures indicate severe hardship for borrowers and losses for lenders. Key metrics like foreclosure starts, sales, and state-level distributions provide insights into emerging risks. Tracking foreclosure completions shows properties reverting to bank ownership. By monitoring these foreclosure trends, lenders can gauge struggling areas, and policymakers can target relief efforts.
- Foreclosure starts increased by 2 basis points to 0.16% in Q1 2023.
- New foreclosures remain very low at 34,000 in Q4 2022.
- 0.57% of loans were in foreclosure in Q1 2023, unchanged from Q4 2022 but up 4 basis points from Q1 2022.
- There were 20,360 foreclosure starts in the U.S. in February 2023, down 2% from January 2023 but up 23% from February 2022.
- States with the most foreclosure starts in February 2023 included: Texas (2,187); California (2,133); Florida (1,831); New York (1,318); and Illinois (1,170).
- Metros with the most foreclosure starts in February 2023 included: New York, NY (1,554); Chicago, IL (1,034); Los Angeles, CA (710); Houston, TX (699); and Philadelphia, PA (565).
- There were 3,831 completed foreclosures (REOs) in the U.S. in February 2023, down 2% from January 2023 but up 45% from February 2022.
- States with the largest annual increases in completed foreclosures in February 2023 included: New York (up 268%), Georgia (up 237%), California (up 132%), Texas (up 87%), and Virginia (up 73%).
- Major metros with the most completed foreclosures in February 2023 included: Chicago, IL (193 REOs); New York, NY (170 REOs); Detroit, MI (112 REOs); Philadelphia, PA (104 REOs); and St. Louis, MO (97 REOs).
Foreclosure Prevention
Loss mitigation programs and initiatives provide critical assistance to troubled borrowers and help prevent avoidable foreclosures. Tracking key metrics on loan modifications, forbearance plans, and other mortgage relief actions illustrates efforts to keep families in their homes.
- The Enterprises (Fannie Mae and Freddie Mac) completed 58,268 foreclosure prevention actions in Q1 2023.
- Since September 2008, the Enterprises have completed 6,771,101 total foreclosure prevention actions.
- Of those actions since 2008, 2,640,651 have been permanent loan modifications, and 3,426,015 have allowed homeowners to stay in their homes.
- 704,435 actions have been short sales or deeds-in-lieu, resulting in borrowers leaving their homes without foreclosure.
- In Q1 2023, 58,268 foreclosure prevention actions were completed, up 11% from Q4 2022.
- The majority of the 58,268 actions in Q1 2023 allowed troubled homeowners to stay in their homes, including 27,069 payment deferrals, 15,500 permanent loan mods, 12,324 forbearances, 3,069 repayment plans, and 158 charge-offs.
- 58,120 home retention actions were completed in Q1 2023, compared to 52,306 in Q4 2022.
- There were 15,500 permanent loan modifications completed in Q1 2023, down from 16,596 in Q4 2022.
- Fannie Mae's permanent loan mods declined 5% to 9,863, and Freddie Mac's decreased 9% to 5,637 in Q1 2023.
- 43% of modified loans in Q1 2023 were 1+ years delinquent, 95% had LTV<=80%, and 16% were originated before 2009.
- Reduce rate and extend term mods fell to 11% of total mods in Q1 2023 due to higher rates.
- 80% of loans modified in Q3 2022 were current and performed 6 months after modification.
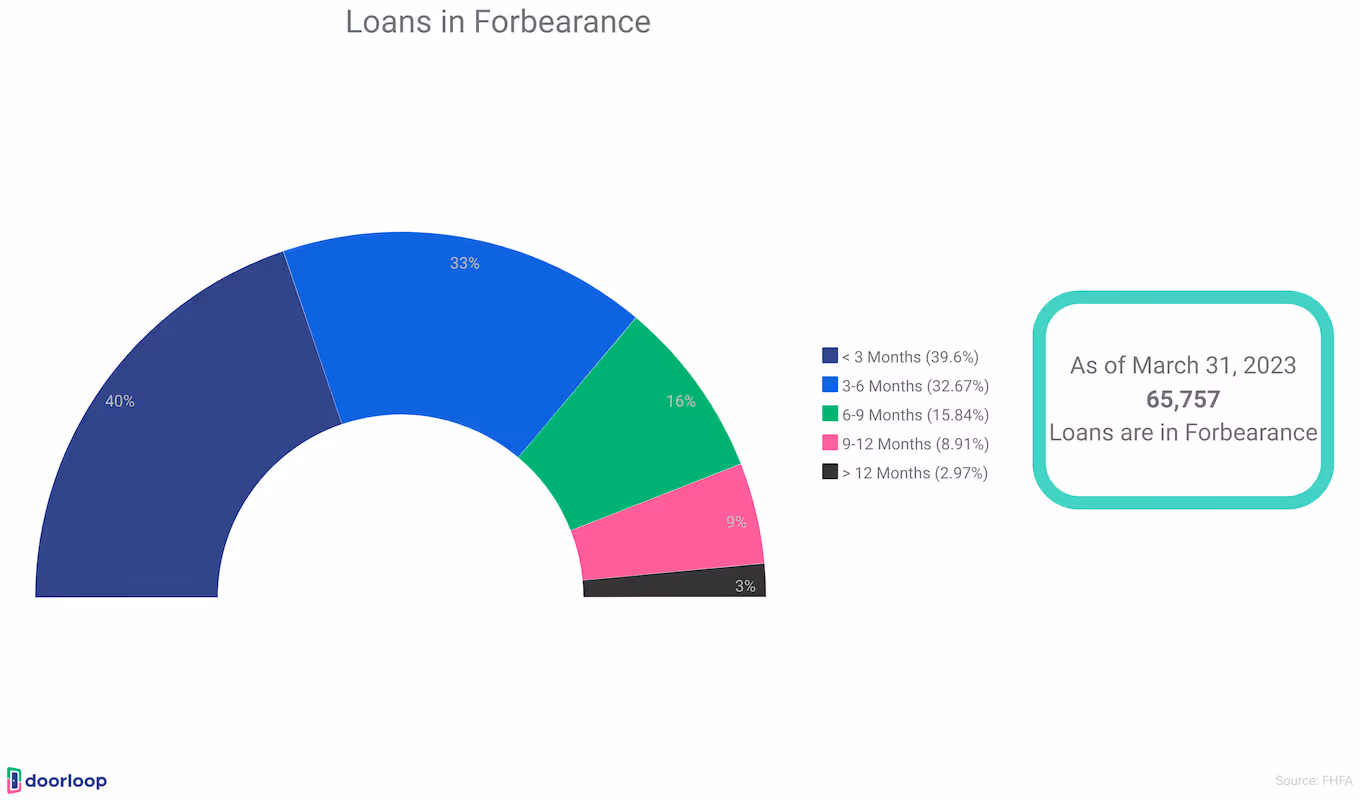
- There were 65,757 loans in forbearance as of March 31, 2023, down from 81,173 in Q4 2022. This represents 0.21% of the Enterprises' single-family book, compared to 0.26% in Q4 2022.
- 3% of loans in forbearance have been on the plan for over 12 months.
- There were 148 short sales and deeds-in-lieu completed in Q1 2023, down 9% from Q4 2022. The total since conservatorship is 704,435.
- There were 3,700 third-party and foreclosure sales completed in Q1 2023, up 12% from Q4 2022.
- Foreclosure starts increased from 18,693 in Q4 2022 to 19,809 in Q1 2023.
- The total number of delinquent loans for the Enterprises decreased in Q1 2023.
- 39% of the Enterprises' troubled borrowers had missed 3+ payments at end of Q1 2023.
- California had the most 90+ days delinquent loans, followed by Florida and Texas.
- 36% of troubled CA borrowers missed 3+ payments, 42% in FL, and 35% in TX as of March 31, 2023.
- 39% of the Enterprises' deeply delinquent loans (365+ days) were in FL, NY, IL, CA, and TX as of March 31, 2023.
- 19% of deeply delinquent loans in NY have been delinquent for over 6 years.
- The Enterprises' 30-day delinquency rate dropped to 0.71%, and the serious delinquency rate fell to 0.60% in Q1 2023.
- In Ohio, the Enterprises' total delinquent loans dropped 20%, and seriously delinquent loans decreased 7% in Q1 2023.
Refinancing Activity
Refinancing loans allows borrowers to lower interest rates and monthly payments or tap home equity through a cash-out refinance. Monitoring refinancing trends and statistics provides useful insights into rate-sensitive borrowing behavior amid shifting economic conditions.
- Total refinance volume increased in March 2023 as mortgage rates decreased through February before rising again in March.
- The average 30-year fixed mortgage rate rose to 6.54% in March 2023, up from 6.26% in February.
- The percentage of cash-out refinances increased to 74% in March 2023.
- Higher rates have reduced non-cash-out refinancing opportunities for borrowers to lower their payments.
- The share of borrowers refinancing into 15-year mortgages increased to 14% in March 2023.
- The interest rate savings of 15-year vs. 30-year mortgages has been higher in 2022-2023 compared to prior years.
- However, higher monthly costs of 15-year mortgages have limited borrower interest in them due to rising rates.
Mortgage Lending
The Home Mortgage Disclosure Act (HMDA) requires many financial institutions to maintain, report, and publicly disclose detailed information about their mortgage lending activity. The 2022 HMDA data provide key insights into the mortgage market by covering over 14 million reported loan applications and 8.4 million originations from 4,460 U.S. lenders.
As the most comprehensive publicly available data on mortgage lending, the annual HMDA data are a critical resource for industry, regulators, consumer advocacy groups, and the general public. The data shine a light on lending patterns, help identify potential fair lending risks, and support the enforcement of anti-discrimination statutes.
Below data points of the 2022 HMDA data present key trends and statistics related to mortgage loan volumes, borrower demographics, lending by geography and institution type, mortgage interest rates, and the disposition of applications. The data indicate notable decreases in refinance lending along with continued racial disparities in access to mortgage credit. As the primary source for understanding who is being served in the mortgage market, the HMDA data offer an indispensable view of this critical element of the financial sector.
- The number of reporting institutions increased by 2.8% in 2022 to 4,460.
- 14.3 million total home loan applications were reported, including 11.5 million closed-end and 2.5 million open-end.
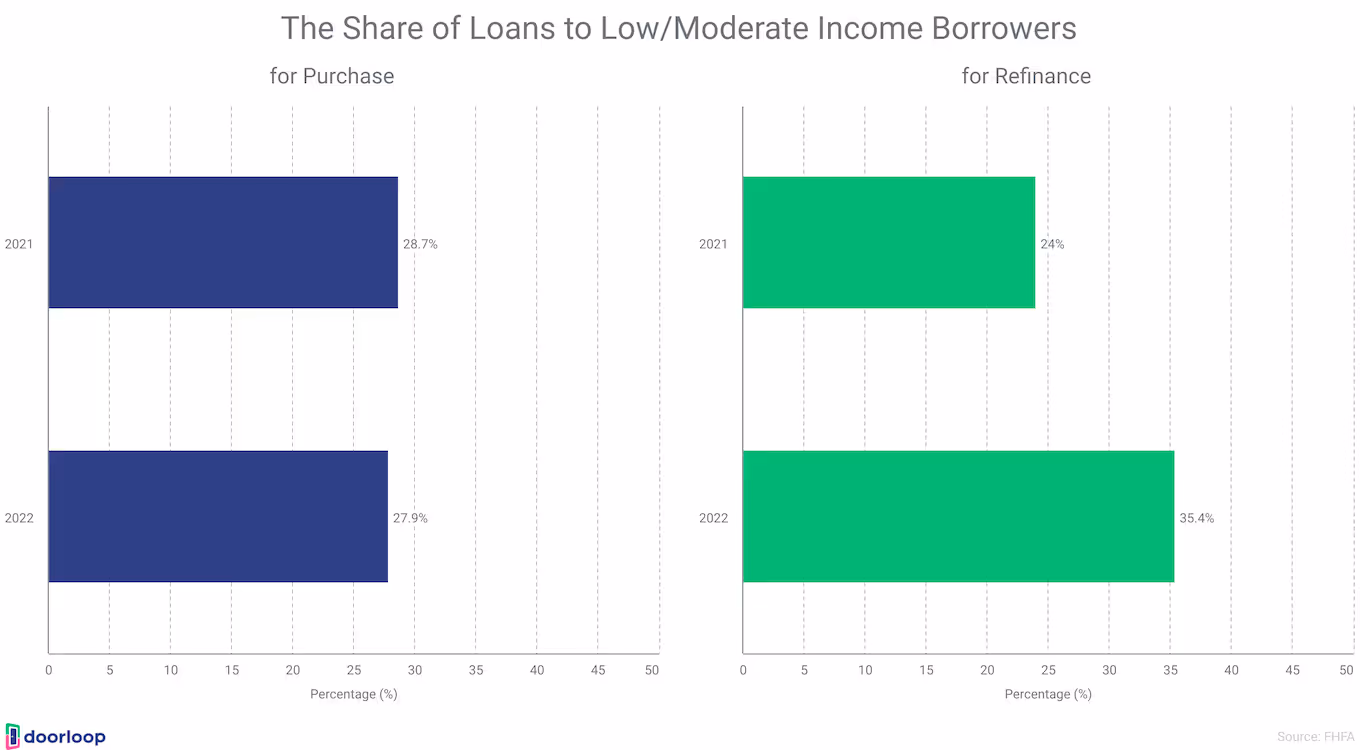
- The share of loans to low/moderate income borrowers was 27.9% for purchases and 35.4% for refinances.
- The share of purchases made to Black borrowers rose to 8.1%, Hispanic-White borrowers decreased to 9.1%, Asian borrowers increased to 7.6%.
- Median credit score on new mortgages declined to 766 in Q4 2022 but remains high.
- 99,000 consumers had new bankruptcy notations in Q4 2022, unchanged from Q3 2022, and remained at historic lows.
- Denial rates were higher for Black and Hispanic-White applicants compared to Asian and non-Hispanic White applicants.
- The FHA share of purchases decreased to 16.3%, and the VA share increased to 10.2%.
- Independent mortgage companies accounted for 72.1% of purchase originations and 62.1% of refinance originations.
- 7,087 high-cost HOEPA loans were reported in 2022.
- Mortgage balances increased by $254 billion in Q4 2022 to $11.92 trillion, a nearly $1 trillion increase during 2022.
- HELOC (home equity lines of credit) balances increased by $14 billion in Q4 2022, the most significant increase in over a decade; the outstanding balance is $336 billion.
Mortgage Origination Volume
Mortgage origination volume metrics quantify lending activity across purchase loans, refinances, and different property types. Tracking mortgage origination dollars and counts over time provides a fundamental overview of market size and borrowing trends.
- The precise number of mortgages in the United States is not known. However, according to a mortgage report from the first quarter of 2022 by the US Census Bureau, the homeownership rate was 65.4%. In comparison, the homeownership mortgage rate was slightly higher at 65.6% for all of 2021. Since 2019, the overall mortgage rate in the US has steadily increased.
- 8.4 million loan originations were reported, including 6.8 million closed-end and 1.4 million open-end.
- 1.6 million purchased loans were reported, for a total of 16.1 million records.
- Closed-end refinance originations decreased 72.8%, and closed-end purchase originations decreased 19.1% from 2021.
Conclusion
In summary, the latest mortgage industry statistics point to declining lending volumes but still elevated activity, persistent disparities in borrower access to credit, rising delinquencies in some segments, and ongoing affordability challenges from high rates. Continued monitoring of these trends can inform policy and credit access. The data indicate lending shifts as rates rise but also risks if broader economic conditions deteriorate.
FAQ
What is the current state of mortgage delinquencies and foreclosures?
Delinquencies fell to a post-crisis low of 3.56% in Q1 2023. However, foreclosure starts rose 23% in February 2023, indicating some borrower distress.
How did mortgage rates and rate forecasts trend?
The average 30-year fixed mortgage rate reached a high of 7% in late 2022 before declining to 6.5% in February 2023. Rates are forecast to remain elevated near 6.8% through late 2023.
What was the impact of higher rates on mortgage affordability?
An increase from 6.5% to 8.125% raises costs by $71,000 over a 30-year mortgage. High rates significantly eroded affordability.
How did economic factors like GDP, unemployment, and inflation trend?
GDP growth slowed to 2.4% by Q2 2023, while inflation moderated to 4.1%. Unemployment ticked down to 3.5% in July but is forecast to rise to 4.4% by the end of 2023.
What was the level of overall mortgage debt outstanding?
Total mortgage debt reached $19,9 trillion in Q2 2023, reflecting nearly $1 trillion in growth YoY.
How did government-backed loan delinquencies compare?
FHA and VA loans had higher delinquency rates of 4.01% and 2.26%, respectively at the end of Q1 2023 versus 0.60% for Fannie/Freddie loans.
Which states saw the largest mortgage delinquency decreases?
Arkansas, Louisiana, West Virginia, Indiana, and Oklahoma experienced the biggest quarterly delinquency rate declines according to Q1 2023 data.
What percentage of troubled borrowers missed 3+ payments?
39% of troubled borrowers missed 3+ mortgage payments at the end of Q1 2023, indicating financial hardship.
Which states had the most 90+ day delinquent loans?
California had the highest number of 90+ days delinquent loans, followed by Florida and Texas as of March 31, 2023.
What were trends in mortgage lending by loan type
Conventional loans saw delinquencies fall 34 basis points in Q1 2023. FHA delinquencies dropped 134 basis points, while VA delinquencies decreased 18 basis points.
What major metros had the most foreclosures?
In February 2023, Chicago, New York, Detroit, Philadelphia, and St. Louis had the most foreclosure activity in major metro areas.
Sources
- attomdata.com
- bea.gov
- bls.gov
- census.gov
- consumerfinance.gov
- fhfa.gov
- fanniemae.com
- freddiemac.com
- mba.org
- newyorkfed.org
- nar.realtor
- statista.com
Frequently Asked Questions