


Key Takeaways
- Multifamily operators should read 2025 housing data as mixed: rental vacancy rose to 7.0%, while homeowner vacancy stayed tight at 1.1%.
- Ownership remains expensive compared with renting: median asking rent is $1,494 per month, while existing home prices near $412,000 to $427,000 exceed 23 times annual rent.
- First-time buyers fell to 21% of purchases, supporting longer renter lifecycles among younger households and reinforcing demand for professionally managed rentals.
- Compare local vacancies, renter incomes, permits, starts, and completions against national benchmarks before raising rents, underwriting acquisitions, or planning dispositions.
Understanding trends in homeownership, rental occupancy, and vacancy rates provides important insight into housing market conditions. These key metrics track the balance of supply and demand in housing, indicating the availability and affordability of both owned homes and rental properties.
Analyzing these measures over time helps reveal whether housing inventory meets population needs and highlights potential areas of imbalance. For landlords, investors, and property managers, monitoring these housing statistics gives perspective on affordability, flexibility, and ownership opportunities across local real estate markets.
Quick Renter & Homeowner Statistics (2025)
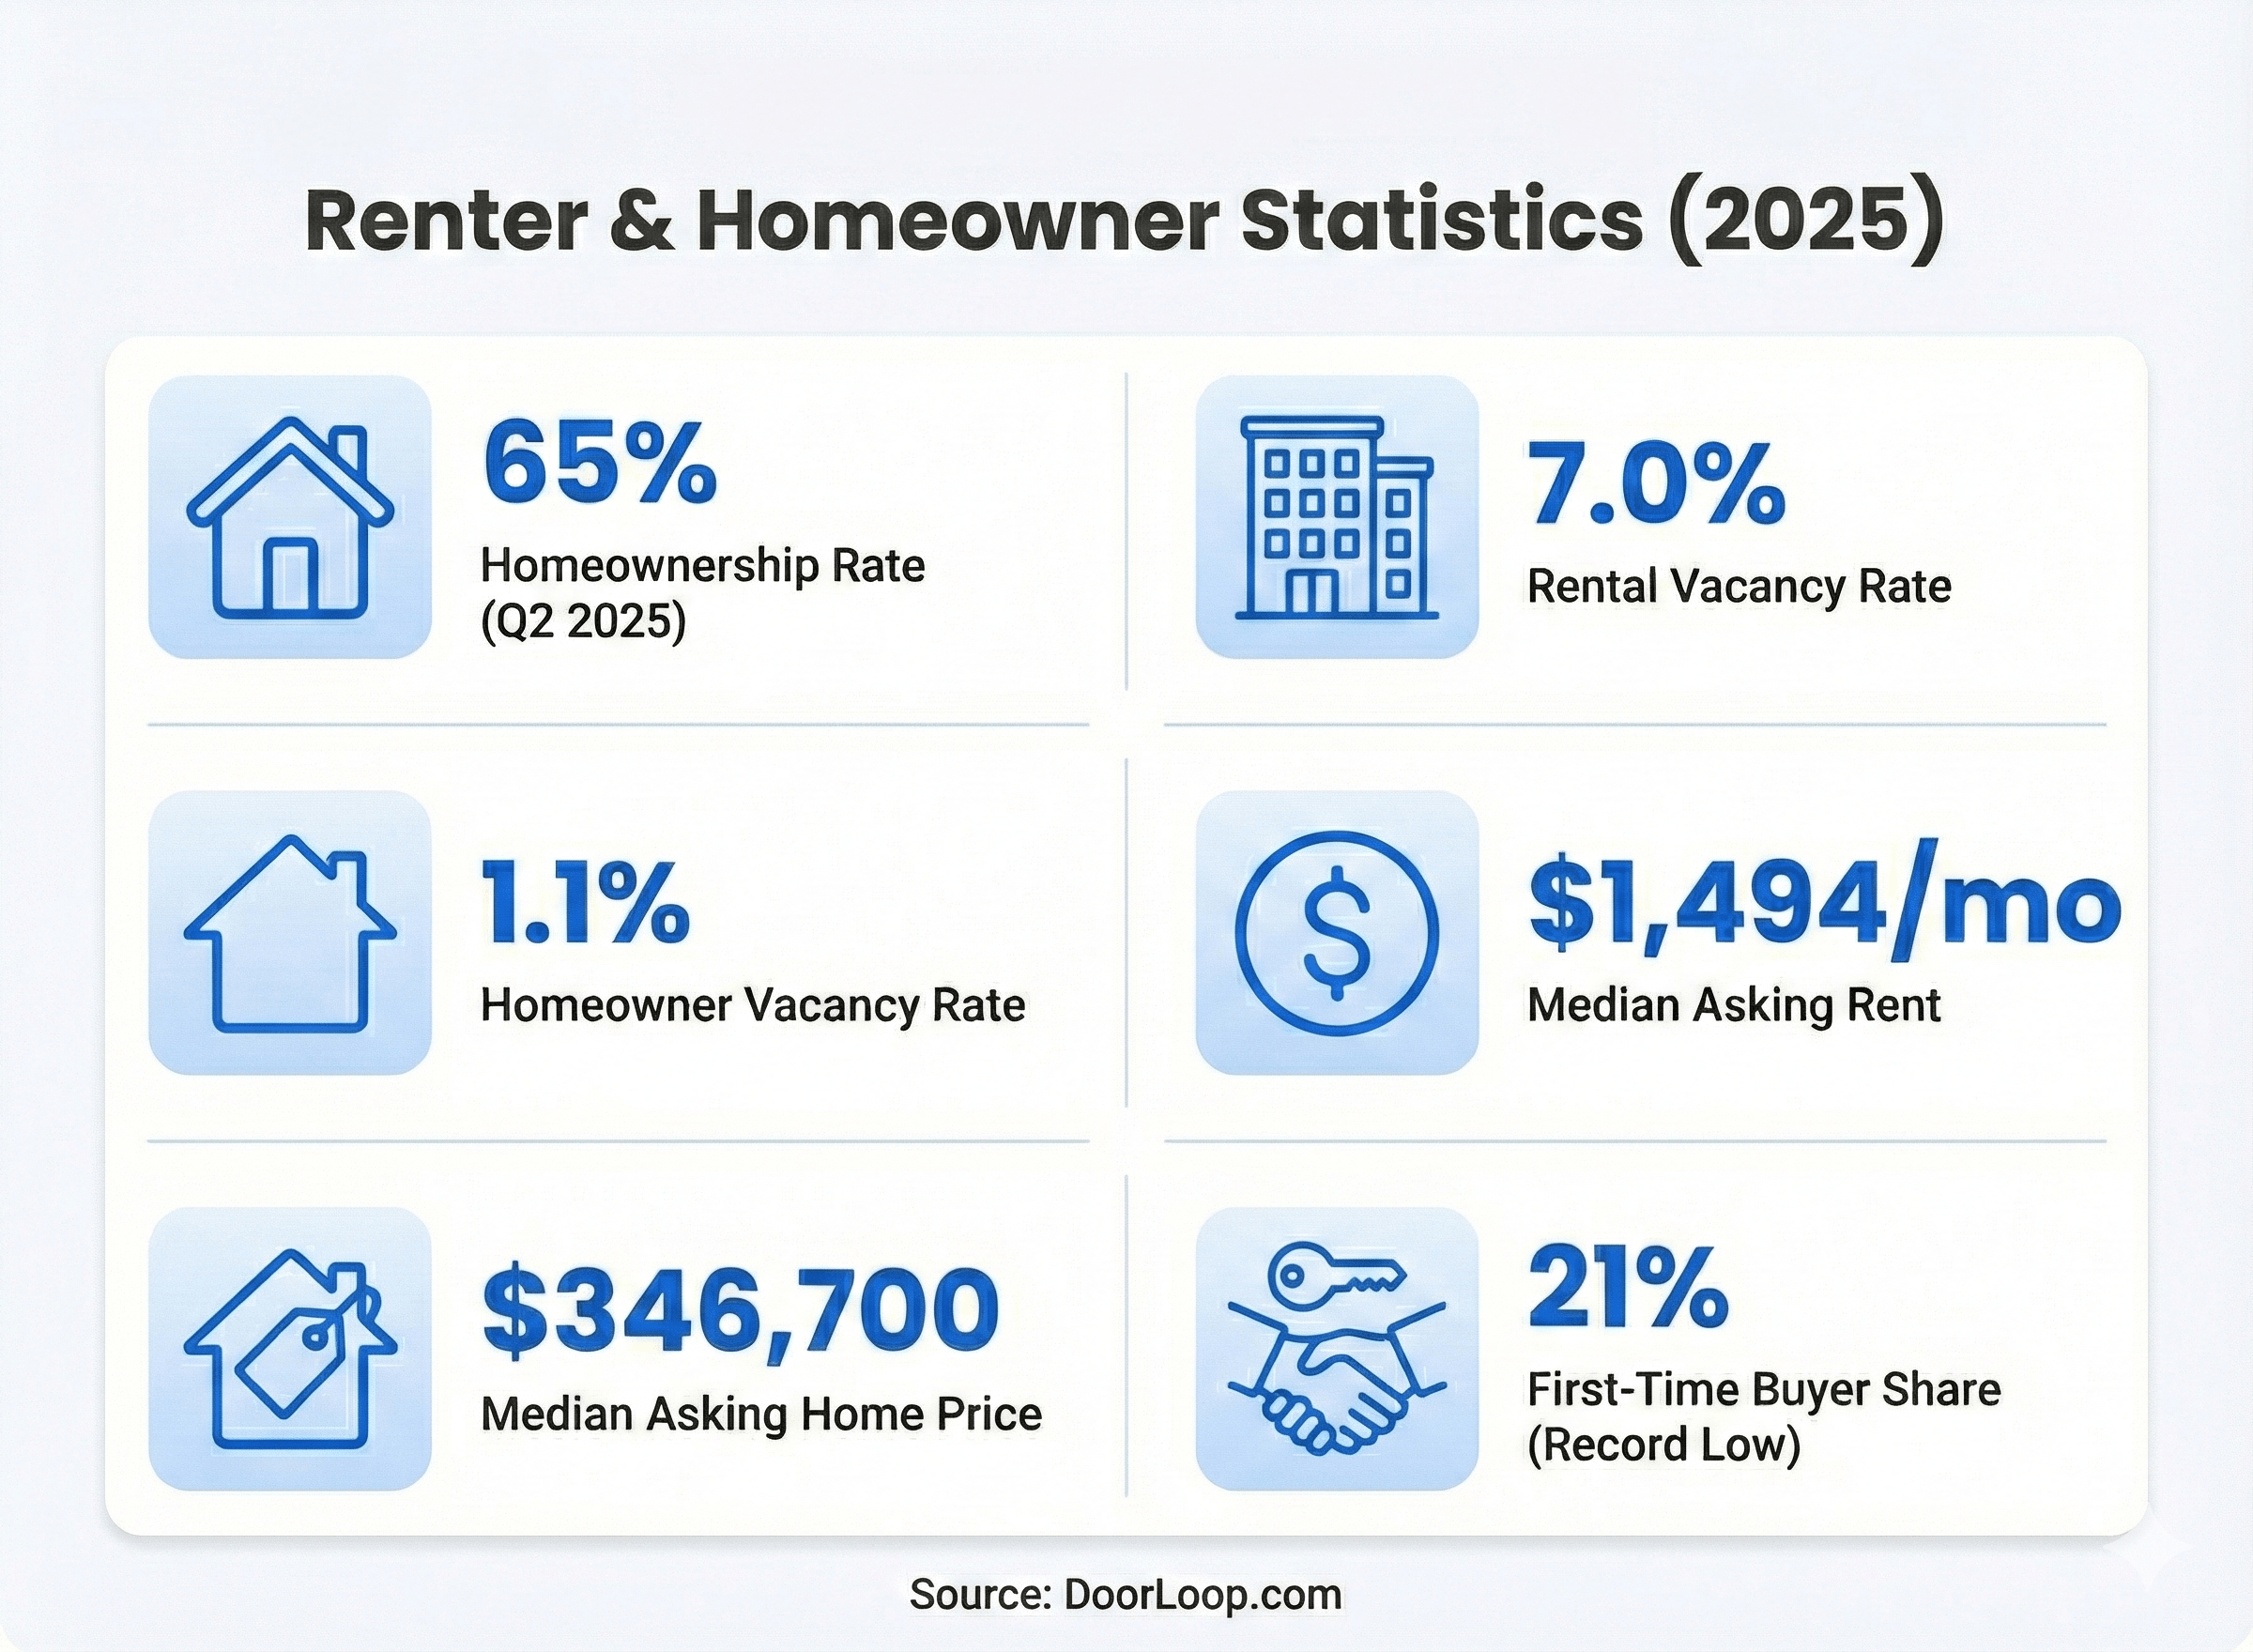
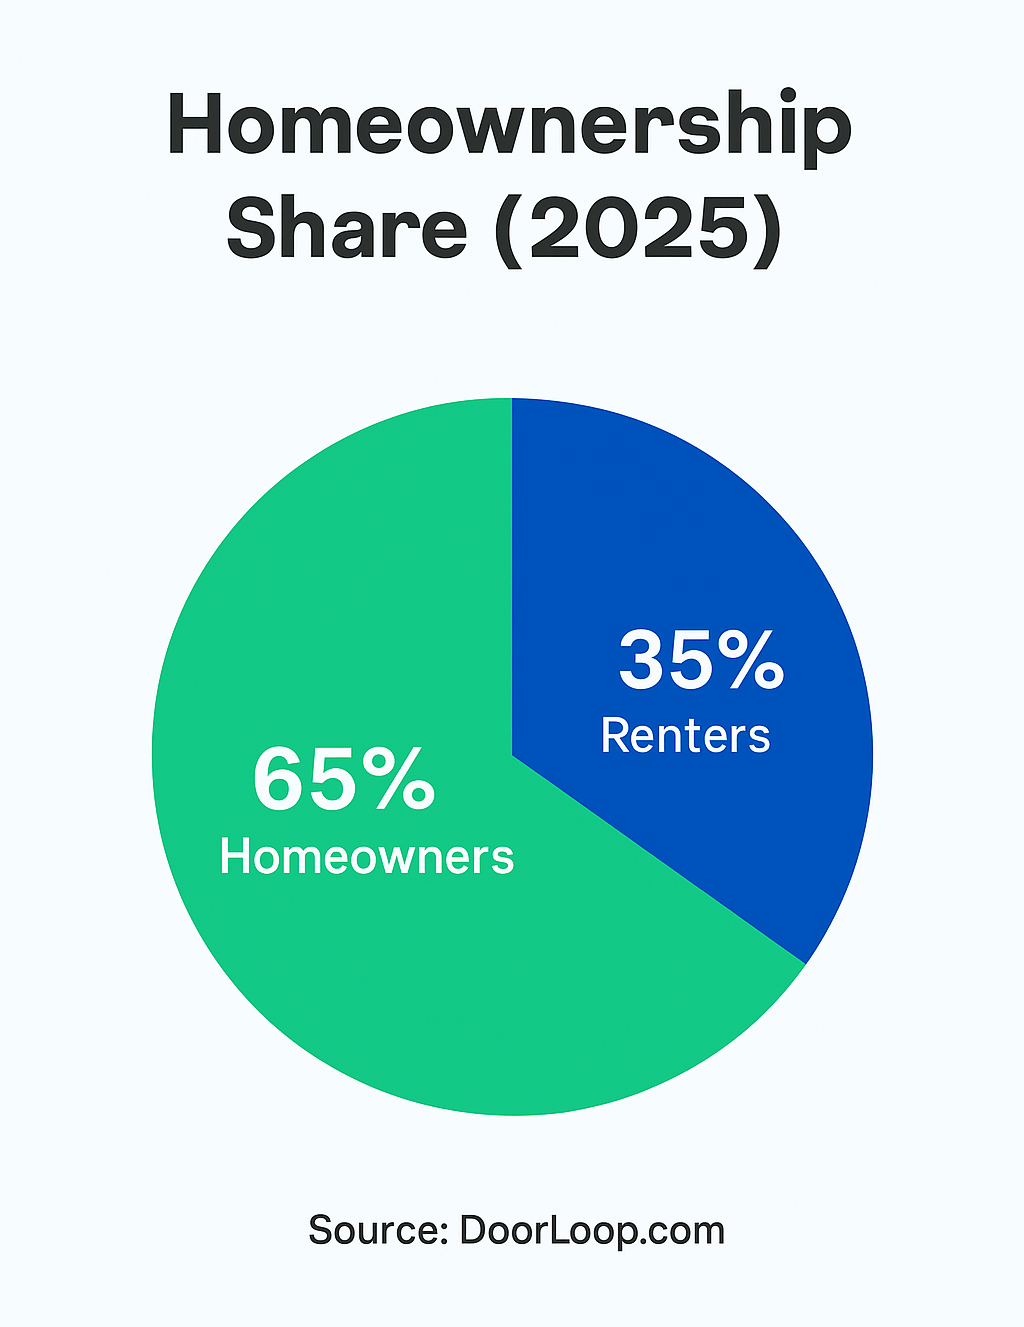
- National homeownership rate: ~65.0% of households own their homes; ~35% rent (Q2 2025).
- Rental vacancy rate: 7.0% nationally, up from 6.6% a year earlier (looser rental market).
- Homeowner vacancy rate: ~1.1%, still extremely low and signaling tight for-sale inventory.
- Median asking rent: about $1,494/month (~$17,928/year) for vacant units.
- Median asking home price: about $346,700, roughly 19× the median annual rent.
- Median existing home price: roughly $412k–$427k, more than 23× the median annual rent.
- First-time buyer share: down to 21% of home purchases, a historic low.
At-a-Glance: Key Housing Benchmarks (2025)
These numbers are drawn from supporting sources in the ACS, Census HVS, NAR, and related datasets.
Understanding Homeownership and Vacancy Trends
Homeownership rates, rental vacancy rates, and broader renter vs. homeowner statistics provide essential housing-market insights for both households and real estate professionals.
- The homeownership rate measures the share of households that own rather than rent, revealing long-term equity-building trends and household wealth.
- The rental vacancy rate tracks the availability of rental units and helps predict rent pressure.
- The homeowner vacancy rate indicates how much for-sale inventory exists and how much pricing power sellers hold.
National & Regional Patterns
- Homeownership:
- U.S. homeownership is roughly 65.0% in Q2 2025, almost unchanged from 65.6% a year earlier.
- The South and Midwest have the highest homeownership rates (around 66–67%), while the Northeast and West lag around ~61%.
- Only the Northeast saw a statistically significant decline vs. last year; other regions are stable.
- Rental vacancies:
- The national rental vacancy rate rose to 7.0%, up from about 6.6%, indicating a slightly looser rental market.
- The Midwest and South recorded higher rental vacancies; the Northeast and West were essentially unchanged.
- Homeowner vacancies:
- The homeowner vacancy rate remains very low at 1.1%.
- The South is highest (around 1.3%), while the Northeast and Midwest hover near 0.8%.
- Low homeowner vacancies mean limited for-sale supply, helping keep prices elevated.
Overall, the latest data suggest balanced national conditions with tight for-sale inventory but a bit more breathing room in the rental market.
Housing Permits, Starts, and Completions
Just as the Existing Post walks through how rent changes tie into broader price and inflation trends, it’s useful here to walk step-by-step through the supply side of housing.
What These Metrics Mean
- Housing permits – new residential construction projects approved by local authorities.
- Housing starts – homes that have actually broken ground.
- Housing completions – homes finished and ready for occupancy.
2025 Construction Snapshot
- Permits (Aug 2025): ~1.312 million annualized, down about 11% year-over-year.
- Starts (Aug 2025): ~1.307 million annualized, down roughly 6% from a year earlier.
- Single-family starts: Around 890,000 annualized, about 7% lower than the month before.
- Completions (Aug 2025): About 1.608 million annualized – down vs. last year, but up vs. the prior month as builders clear backlogs.
Why It Matters for Landlords & Investors
- Fewer permits & starts today can mean tighter supply in the future.
- Higher completions right now add supply and may relieve price pressure in some markets.
- If demand rebounds while permits and starts stay low, prices and rents could accelerate again.
Homeowners vs. Renters: A Demographic Breakdown
How Many Households Rent vs. Own?
- ~44 million renter households, about 35% of all U.S. households.
- ~82 million homeowner households, about 65% of all households.
Over time, this mix has shifted as homeownership rates declined from the mid-2000s peak and then stabilized in the mid-60% range.
Age Profile
- Median age of homeowners: ~57 years.
- Median age of renters: ~43 years.
- 70%+ of homeowners are age 45+.
- Around half of renters are under 35; only ~10% are 65+ renters.
Takeaway: owning is still heavily associated with middle age and older, while renting is dominated by younger adults.
Household Type
- Renters:
- ~38% live alone.
- ~26% are married/partnered couples.
- ~24% are other family arrangements.
- ~12% are roommates or non-family housemates.
- Homeowners:
- Nearly 60% are married couples.
- Over 70% are family households (with spouses, children, or extended family).
Race & Ethnicity
- Share of all homeowners:
- White (non-Hispanic): ~75%
- Black: ~8%
- Hispanic: ~10%
- Share of all renters:
- White (non-Hispanic): ~52%
- Black: ~20%
- Hispanic: ~20%
These differences reflect large gaps in homeownership rates:
- White: ~74%
- Black: ~44%
- Hispanic/Latino: ~49%
Income & Education
- Median homeowner income: ~$90,000.
- Median renter income: ~$40,000.
- Homeowners are more likely to have college or postgraduate degrees, with postgrads especially skewed towards ownership.
Credit & Financial Profile
- Average homeowner credit score: ~754 (“excellent”).
- Average renter credit score: ~638 (“fair”).
Better credit and higher incomes give homeowners easier access to mortgages and other credit products.

Owners vs. Renters – Side-by-Side
Wealth Gap Between Owners and Renters
- Median homeowner net worth: about $396,000.
- Median renter net worth: about $10,400.
- Homeowner wealth is roughly 38× renter wealth.
Because home equity is such a large part of household wealth, these statistics make clear why access to homeownership has major long-term consequences.
Multigenerational Living & Generational Shifts
- 25% of adults 25–34 lived in multigenerational households in 2021 (vs. 9% in 1971).
- Millennials have a homeownership rate of ~43% vs. ~78% for baby boomers.
- The median age of a first-time buyer is now 40, up from 29 in 1981.
More young adults are renting longer and living with family, which delays first-time purchases and reshapes rental demand.
The Rising Costs of Homeownership
Just as the Existing Post explains how and why landlords raise rent, this section breaks down why ownership costs have surged and how that affects renters’ ability to buy.
Price-to-Rent Ratios
- Median asking rent: $1,494/month → $17,928/year.
- Median asking home price: $346,700 → ~19× median annual rent.
- Median existing home price: $412k–$427k → 23×+ median annual rent.
This price-to-rent ratio is higher than historic norms, making the leap from renting to owning much harder.
Affordability Index & Monthly Payments
- NAR’s Composite Housing Affordability Index fell from 128.2 (Q1 2022) to the mid-90s thereafter – the worst in over a decade.
- A typical median-priced home with 20% down now has a P&I payment around $1,840, roughly 50% more than a few years ago when prices were lower and rates were 3%.
- A starter home (~$315,500) with 10% down carries an estimated $1,825 monthly mortgage payment, plus taxes and insurance.
Mortgage Rates
- 2020–2021: ~3% 30-year fixed rates.
- 2022–2023: Rates jumped into the 6–7% range.
- Late 2025: Rates eased slightly but are still around the low-6% range, roughly double early-decade levels.
Higher rates mean the same monthly budget buys less house.
First-Time Buyers Under Pressure
- 2021: First-time buyers ~34% of purchases.
- 2022: Down to 26%.
- 2025: Just 21% – a record low.
This collapse shows how down payments, high monthly costs, and strict underwriting are keeping new buyers out.
Ownership Costs – Summary Table
For many renters, the combination of high prices + high rates + high taxes/insurance makes ownership unattainable, even if their rent is already expensive.
How Landlords & Investors Can Use These Benchmarks
Mirroring the “Is There an Official System?” and “When Is a Good Time to Raise Rent?” guidance in the Existing Post, here’s how you can turn these stats into decisions.
1. Gauge Local Demand vs. National Benchmarks
- Compare your local homeownership rate and rental vacancy rate to national figures (65.0% and 7.0%).
- Higher local vacancies may mean more competition and slower rent growth.
- Lower local vacancies may justify stronger rents but also call for more tenant-friendly communication.
2. Plan Rent Increases with Vacancy & Income in Mind
- If vacancies are rising in your area, aggressive rent increases could backfire.
- Use median renter income (~$40,000) and median rent as a guardrail to avoid pricing out solid tenants.
3. Identify Investor Opportunities
- Watch permits, starts, and completions:
- Fewer permits + fewer starts → future supply constraints.
- Strong completions now → short-term inventory bump and possible negotiation leverage.
- Look for markets where rents are still growing but ownership is very expensive (high price-to-rent ratios) – these often favor long-term rental demand.
4. Track Affordability for Exit Strategies
- Low affordability (index in the 90s) can:
- Support strong rental demand (more people must rent).
- Make it harder to sell to owner-occupants.
- If mortgage rates drop and affordability improves, it may mark a better window to sell.
How Often Are These Housing Stats Updated?
Just as the Existing Post hints that rent data is continually changing, these benchmarks also move throughout the year.
- Homeownership & vacancy rates (Census HVS) – updated quarterly.
- Permits, starts, completions (Census construction series) – updated monthly.
- Prices & affordability (NAR, FHFA) – updated monthly/quarterly.
- Rents (Census, private indexes) – updated monthly or quarterly depending on the source.
For landlords and investors, checking these at least once or twice a year is a good practice when planning rent changes, acquisitions, or dispositions.
Conclusion
Nationally, homeownership rates have held steady in the mid-60% range through 2024–2025, signaling stability in the overall balance between owned and rented housing. Beneath that stability, however, are clear demographic divides: homeowners tend to be older, higher-income, and have stronger credit than renters, and racial homeownership gaps remain large.
At the same time, housing costs have surged. Prices are near record highs, mortgage rates are roughly double their pandemic lows, and property taxes and insurance keep climbing. That combination has pushed affordability to its weakest point in many years and driven the share of first-time buyers to historic lows.
For renters, this environment makes transitioning into ownership difficult. For landlords, it means strong structural rental demand, but also tenants who are stretched thin by broader cost-of-living increases. For policymakers, it highlights the need to address supply constraints, down-payment barriers, and racial inequities in access to credit and homeownership.
Going forward, keeping an eye on key benchmarks – homeownership rate, vacancy rates, price-to-rent ratios, affordability indexes, and construction activity – will be essential. Together, they tell the story of how accessible housing is, where pressure is building, and how the balance between renting and owning is evolving.
Sources
All statistics in this article are drawn from large, reputable data sources, with an emphasis on official U.S. government datasets.
- Core housing and vacancy figures come from the U.S. Census Bureau’s Housing Vacancy Survey (HVS) and American Community Survey (ACS), including tables on homeownership, vacancies, and median gross rent.
- New construction data (permits, starts, and completions) come from the Census New Residential Construction reports.
- Home price trends are based primarily on the FHFA House Price Index and National Association of REALTORS® (NAR) statistics on existing-home sales and median prices, as well as NAR’s Housing Affordability Index.
- Mortgage rate trends are taken from the Federal Reserve’s FRED database and related market data.
- Wealth and net-worth comparisons between owners and renters rely on the Federal Reserve’s Survey of Consumer Finances and analysis from the Urban Institute.
- Demographic and multigenerational living statistics are sourced from the Pew Research Center and related summaries that build on Pew’s work.
Citations:
- U.S. Census Bureau – Housing Vacancies and Homeownership (HVS)
- U.S. Census Bureau – Quarterly Residential Vacancies and Homeownership, Q1 2025
- U.S. Census Bureau – New Residential Construction (Permits, Starts, Completions)
- U.S. Census Bureau – ACS Table B25064: Median Gross Rent (Dollars)
- Federal Housing Finance Agency (FHFA) – U.S. House Price Index Report, 2025 Q2
- National Association of REALTORS® – Housing Affordability Index
- National Association of REALTORS® – Existing-Home Sales Data
- Board of Governors of the Federal Reserve System – Survey of Consumer Finances (SCF)
- Urban Institute – “The Wealth Gap between Homeowners and Renters Has Reached a Historic High”
- Federal Reserve Bank of St. Louis (FRED) – 30-Year Fixed Rate Mortgage Average in the United States
- Pew Research Center – “The demographics of multigenerational households”
- World Economic Forum (summarizing Pew data) – “How many young adults live in multigenerational households in the US?
Frequently Asked Questions