


Foreclosure is the process of repossessing a property. This happens when a borrower fails to pay their mortgage payments. In mortgage loans, the borrower’s home becomes the collateral. Foreclosure allows lenders to recover the amount of losses they incur when a borrower defaults on their mortgage.
During the Great Recession, the number of foreclosures in the nation rose to over a million. Not only did it cause significant financial distress, it also displaced millions of families and individuals. During the peak of the pandemic, the U.S. economy prepared for another wave of housing foreclosures. With the economic struggles we recently had, it’s only essential to know if we’re about to hit another foreclosure wave. Here are the figures and facts on foreclosure you need to know.
KEY TAKEAWAYS
- Each state has a limit on the allowable foreclosure attorney fees. As of Q4 2022, Maryland has the highest allowable fee for non-judicial foreclosures at $3,350. For judicial foreclosures, Hawaii has the highest allowable foreclosure attorney fee at $9,350, followed by the state of New York with $5,650. The states with the lowest allowable attorney fees for non-judicial foreclosures are Nebraska, New York, and West Virginia at $1,600. For judicial foreclosure states, South Dakota has the lowest allowable attorney fee at $2,500.
- During the first six months of 2023, the foreclosure activity in some states increased significantly. Maryland tops the list with a 100% increase in foreclosure activity. Closely behind Maryland is the state of Oregon with 99%, Alaska with 95%, West Virginia with 83%, and Arkansas with a 72% increase in foreclosure activity.
- The highest recorded number of foreclosures in the United States was 1,178,234, which happened in 2010. During this period, 1 in 33 homeowners with children faced foreclosure, as 38% of the affected were rental properties.
- In the subprime mortgage crisis during the Great Recession, 31.7% of Hispanic borrowers’ and 28.6% of Black borrowers’ homes went into foreclosure. Most of these groups were living in the Inland Empire, which eventually became known as the “foreclosure capital” of the nation. During this period, over 5% of all homes in Inland Empire were in foreclosure with Riverside and San Bernardino counties having nearly 6 and 3.5 times larger foreclosure rates than neighboring Los Angeles County.
- During the pandemic, 44% of single-family rental owners had a mortgage or similar debt they struggled to pay for and were at risk of foreclosure and bankruptcy. “Mom and pop” landlords who own 22.7 million single-family and duplex rental homes were also at risk of foreclosure due to the lack of rental income.
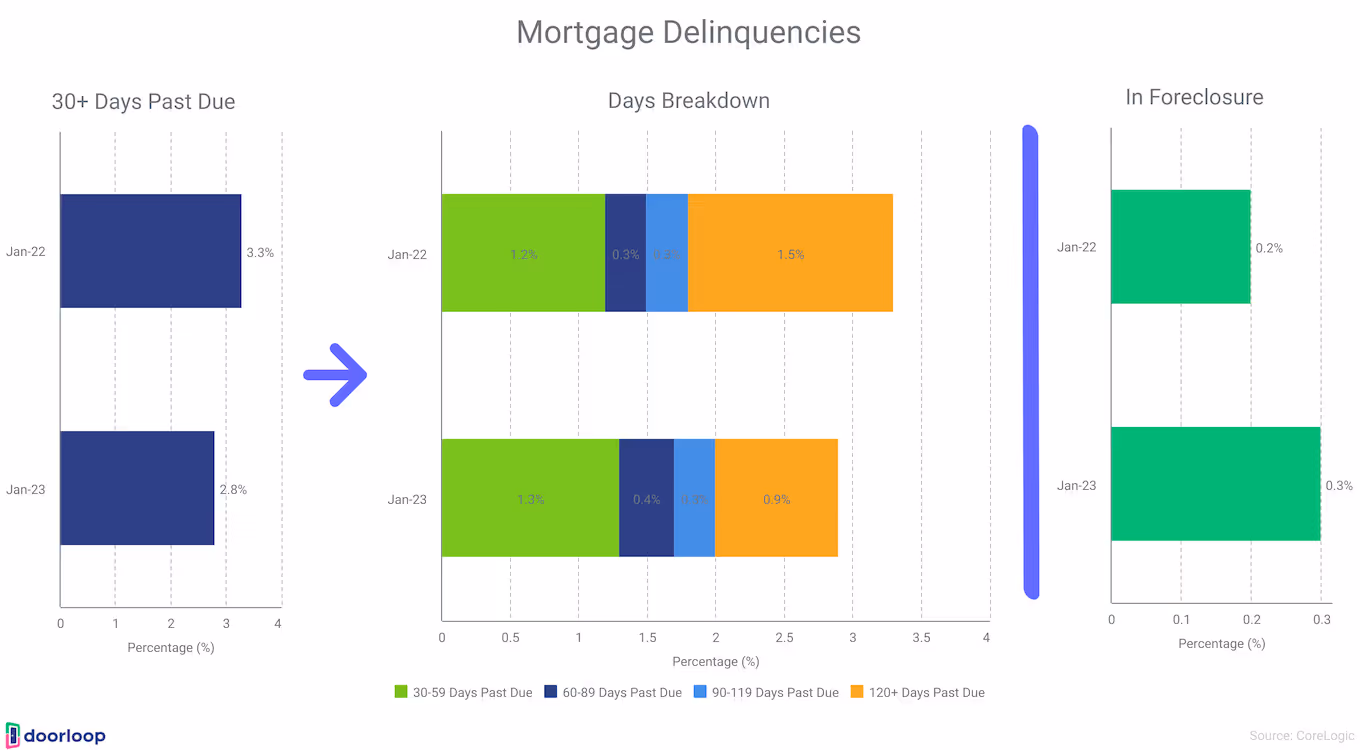
- The mortgage delinquency in the United States remained low in Q4 2022 and Q1 2023. In December 2022, the mortgage delinquency rate was 3%, while the foreclosure rate was 0.3%. Despite being higher than the first half of 2022, these rates are still considered low. By January 2023, the serious delinquency rate is 1.2% lower than it was during the same period in 2022.
Insights on Foreclosures in the United States
Historically, foreclosure became the symbol of the Great Recession. That being said, foreclosures are never a good sign. Recently, there’s been an uptick in the number of foreclosures in the United States. Here are the things you need to know:
- Only 21 states predominantly use judicial foreclosure. These states include Connecticut, Delaware, Florida, Hawaii, Illinois, Indiana, Iowa, Kansas, Kentucky, Louisiana, Maine, New Jersey, New Mexico, New York, North Dakota, Ohio, Oklahoma, Pennsylvania, South Carolina, Vermont, and Wisconsin. Both Hawaii and The District of Columbia use a non-judicial foreclosure process. In New Mexico, non-judicial foreclosure may be used for residential loans after 2006.
- On the other hand, 30 states predominantly use the non-judicial foreclosure process. These states are Alabama, Alaska, Arizona, Arkansas, California, Colorado, Georgia, Hawaii, Idaho, Maryland, Massachusetts, Michigan, Minnesota, Mississippi, Missouri, Montana, Nebraska, Nevada, New Hampshire, North Carolina, Oregon, Rhode Island, South Dakota, Tennessee, Texas, Utah, Virginia, Washington, West Virginia, and Wyoming. In Colorado and Maryland, court supervision is still needed despite following a non-judicial foreclosure process.
- In a 2008 study on foreclosures, medical disruptions were found to be a major contributor to mortgage default as 49% of people reported that their foreclosure was caused in part by a medical problem. This is followed by illness or injuries (32%), lost work due to a medical problem (27%), unmanageable medical bills (23%), and caring for sick family members (14%).
- The probability of divorce in marginal households increases by 6.5% after three to four years of filing for foreclosure. The probability of divorce for the non-foreclosure group is only about 2.7%.
- There’s roughly a 19% increase in the number of reported violent crime rates within 250 feet of a home in the process of foreclosure. The increase in crimes is primarily driven by the vacancy associated with the foreclosure process and the crime rate increases as the property stays vacant for longer periods of time.
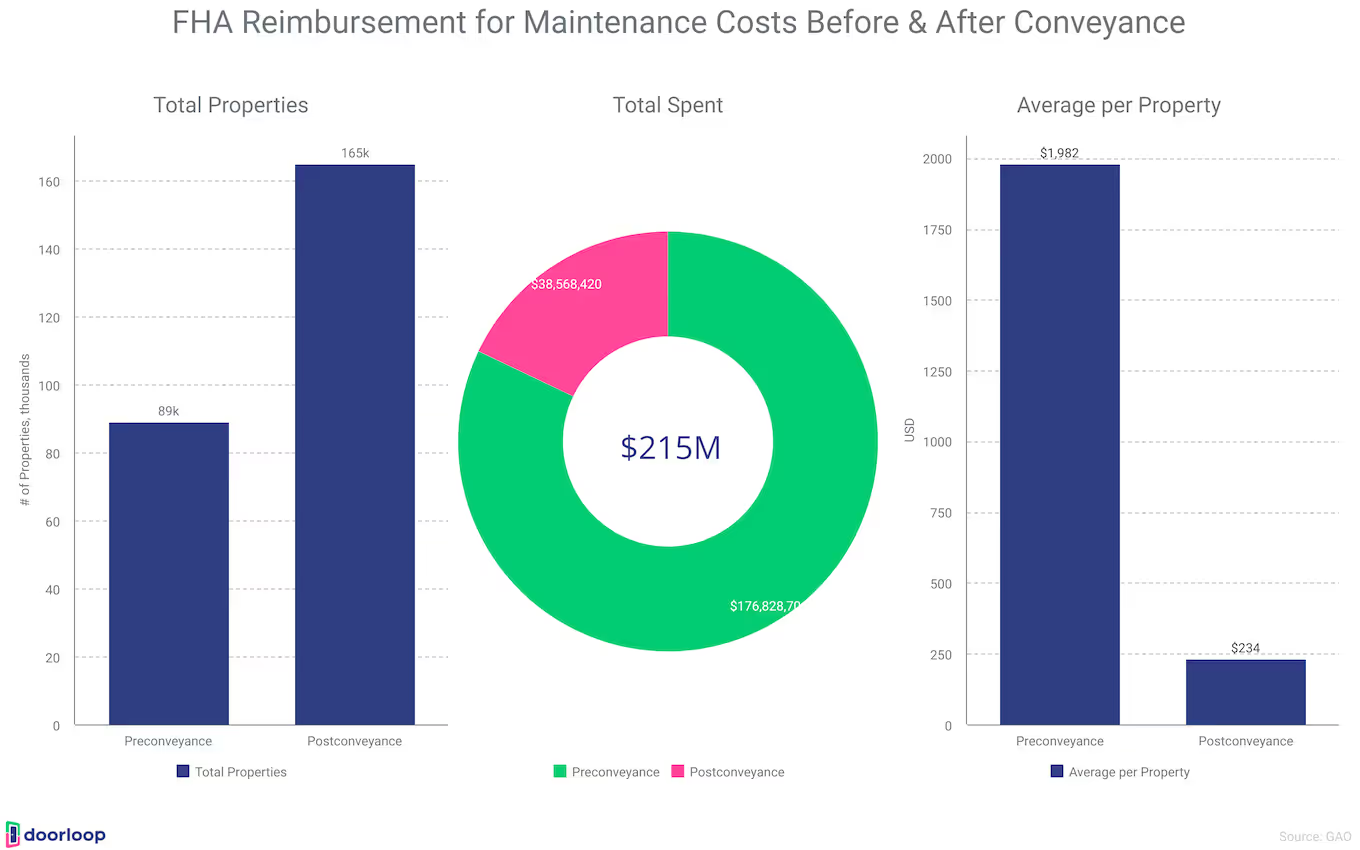
- Federal agencies can spend up to $1,744 per foreclosed property. Following the housing crisis in 2010, the primary post-foreclosure costs were for trash removal and yard maintenance. Federal agencies spent an average of $1,744 on maintenance per post-foreclosed property.
- As of Q4 of 2022, Maryland has the highest allowable foreclosure attorney fee on non-judicial foreclosure at $3,350. On the other hand, Nebraska, New York, and West Virginia have the lowest allowable attorney fees on non-judicial foreclosure at $1,600.
Allowable Foreclosure Attorney Fees
<table><tr><th>State</th><th>Non-Judicial Foreclosure</th><th>Judicial Foreclosure</th></tr><tr><td>Alabama</td><td>$1,900</td><td>On Approval</td></tr><tr><td>Alaska</td><td>$2,300</td><td>On Approval</td></tr><tr><td>Arizona</td><td>$1,900</td><td>On Approval</td></tr><tr><td>Arkansas</td><td>$1,950</td><td>On Approval</td></tr><tr><td>California</td><td>$1,900</td><td>On Approval</td></tr><tr><td>Colorado</td><td>$2,400</td><td>On Approval</td></tr><tr><td>Connecticut</td><td>N/A</td><td>$3,750</td></tr><tr><td>Delaware</td><td>N/A</td><td>$2,650</td></tr><tr><td>District of Columbia</td><td>N/A</td><td>$3,200</td></tr><tr><td>Florida</td><td>N/A</td><td>$4,750</td></tr><tr><td>Georgia</td><td>$1,900</td><td>On Approval</td></tr><tr><td>Guam</td><td>$2,550</td><td>On Approval</td></tr><tr><td>Hawaii</td><td>N/A</td><td>$9,350</td></tr><tr><td>Idaho</td><td>$1,700</td><td>On Approval</td></tr><tr><td>Illinois</td><td>N/A</td><td>$3,350</td></tr><tr><td>Indiana</td><td>N/A</td><td>$3,200</td></tr><tr><td>Iowa</td><td>On Approval</td><td>$2,700</td></tr><tr><td>Kansas</td><td>N/A</td><td>$2,700</td></tr><tr><td>Kentucky</td><td>N/A</td><td>$3,350</td></tr><tr><td>Louisiana</td><td>N/A</td><td>$2,700</td></tr><tr><td>Maine</td><td>N/A</td><td>$4,300</td></tr><tr><td>Maryland</td><td>$3,350</td><td>On Approval</td></tr><tr><td>Massachusetts</td><td>N/A</td><td>$4,000</td></tr><tr><td>Michigan</td><td>$2,200</td><td>On Approval</td></tr><tr><td>Minnesota</td><td>$2,050(9)</td><td>On Approval</td></tr><tr><td>Mississippi</td><td>$1,700</td><td>On Approval</td></tr><tr><td>Missouri</td><td>$1,900</td><td>On Approval</td></tr><tr><td>Montana</td><td>$2,000</td><td>On Approval</td></tr><tr><td>Nebraska</td><td>$1,600</td><td>On Approval</td></tr><tr><td>Nevada</td><td>$2,250</td><td>On Approval</td></tr><tr><td>New Hampshire</td><td>$1,900</td><td>On Approval</td></tr><tr><td>New Jersey</td><td>N/A</td><td>$5,200</td></tr><tr><td>New Mexico</td><td>N/A</td><td>$4,450</td></tr><tr><td>New York</td><td>$1,600</td><td>$5,650</td></tr><tr><td>North Carolina</td><td>$2,500</td><td>On Approval</td></tr><tr><td>North Dakota</td><td>N/A</td><td>$2,550</td></tr><tr><td>Ohio</td><td>N/A</td><td>$3,450</td></tr><tr><td>Oklahoma</td><td>N/A</td><td>$3,000</td></tr><tr><td>Oregon</td><td>$1,900</td><td>On Approval</td></tr><tr><td>Pennsylvania</td><td>N/A</td><td>$3,450</td></tr><tr><td>Puerto Rico</td><td>N/A</td><td>$3,300</td></tr><tr><td>Rhode Island</td><td>$2,500</td><td>On Approval</td></tr><tr><td>South Carolina</td><td>N/A</td><td>$3,150</td></tr><tr><td>South Dakota</td><td>N/A</td><td>$2,500</td></tr><tr><td>Tennessee</td><td>$1,700</td><td>On Approval</td></tr><tr><td>Texas</td><td>$1,900</td><td>$3,100</td></tr><tr><td>Utah</td><td>$1,900</td><td>On Approval</td></tr><tr><td>Vermont</td><td>N/A</td><td>$3,550</td></tr><tr><td>Virgin Islands</td><td>N/A</td><td>$3,050</td></tr><tr><td>Virginia</td><td>$2,300</td><td>On Approval</td></tr><tr><td>Washington</td><td>$2,000</td><td>$3,550</td></tr><tr><td>West Virginia</td><td>$1,600</td><td>On Approval</td></tr><tr><td>Wisconsin</td><td>N/A</td><td>$2,800</td></tr><tr><td>Wyoming</td><td>$1,700</td><td>On Approval</td></tr></table>
- For judicial foreclosures, the state of Hawaii has the highest allowable foreclosure attorney fee with $9,350. This is followed by New York with $5,650. South Dakota has the lowest allowable attorney fee with $2,500. In most states, judicial foreclosures are not the preferred method of foreclosure, so the allowable attorney fees are subject to approval.
- By December 2022, the rate of foreclosure starts was 21.0, which is a lot higher than the foreclosure completion rate of 3.7. These rates are higher than it was last year; the rate of foreclosure starts in 2021 was only 9.2, and the rate of foreclosure completions was only 3.0.
- In the first quarter of 2023, the average time to foreclose a property is 950 days. This figure is 12% higher than it was during the fourth quarter of 2022. If we compare it to the first quarter of last year, 950 days is 4% higher.
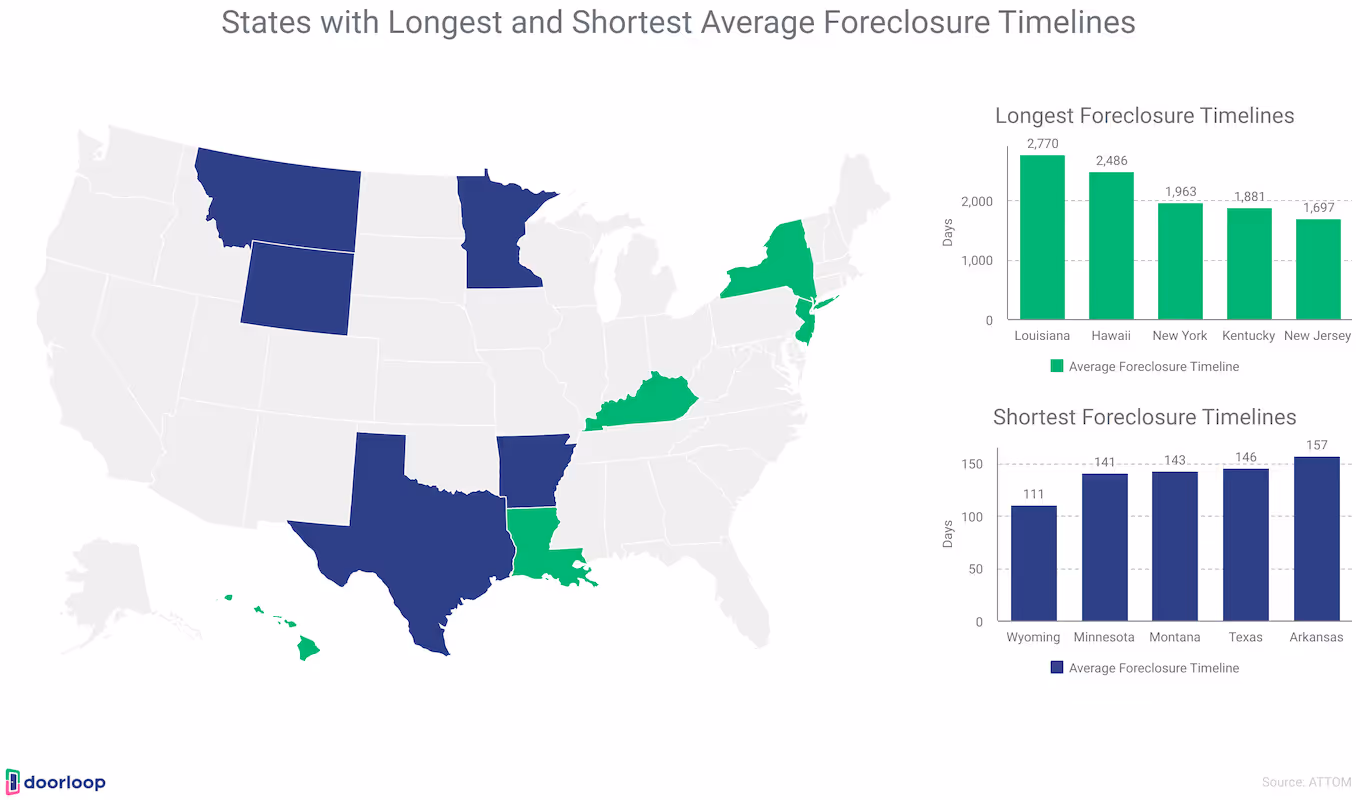
- Louisiana has the longest average foreclosure timeline in Q1 of 2023 with 2,770 days. This is followed by Hawaii with 2,486 days, New York with 1,963 days, Kentucky with 1,881 days, and New Jersey with 1,697 days.
- Wyoming has the shortest average timeline for foreclosure in Q1 of 2023 with 111 days. This is followed by Minnesota with 141 days, Montana with 143 days, Texas with 146 days, and Arkansas with 157 days.
- During the first six months of 2023, there were a total of 185,580 U.S. properties with foreclosure filings. The number of properties with foreclosure filings from January to June is 13% higher than it was during the first six months of 2022 and 185% higher than it was during the first six months of 2021.
- Maryland has the greatest increase in foreclosure activity (up 100%) during the first and second quarters of 2023. Maryland is followed closely by Oregon with a 99% increase in foreclosure activity, Alaska with 95%, West Virginia with 83%, and Arkansas with 72%.
- Considering all housing units in the United States, there were about 0.13% foreclosure filings in the first half of 2023. This rate is equal to one housing unit in every 752 housing units.
- During the first six months of 2023, 135,065 properties started the foreclosure process. This number is 15% higher than the first half of 2022 and 36% higher than the same period in 2020.
- Bank repossessions climbed to a total of 22,672 properties during the first half of 2023. Despite being 40% less than it was during the first half of 2020, the number is still 9% higher than it was during the same period last year and 133% higher than it was in 2021.
- Cleveland (0.33%), Atlantic City (0.33%), and Fayetteville (0.30%) have the highest foreclosure rates in the first six months of 2023. These three places have the highest foreclosure rates among 223 metropolitan areas with at least 200,000 in population. Columbia (0.29%) and Lakeland (0.29%) follow Fayetteville.
- Distressed sales–foreclosures and short sales–account for 2% of total existing home sales as of July 2023. This percentage is virtually the same as the rate from June and 2022.
- There are 311,508 residential properties in the process of foreclosure during the second quarter of 2023. Compared to the first quarter, the number of properties in the process of foreclosure was 4.3% higher during the second quarter.
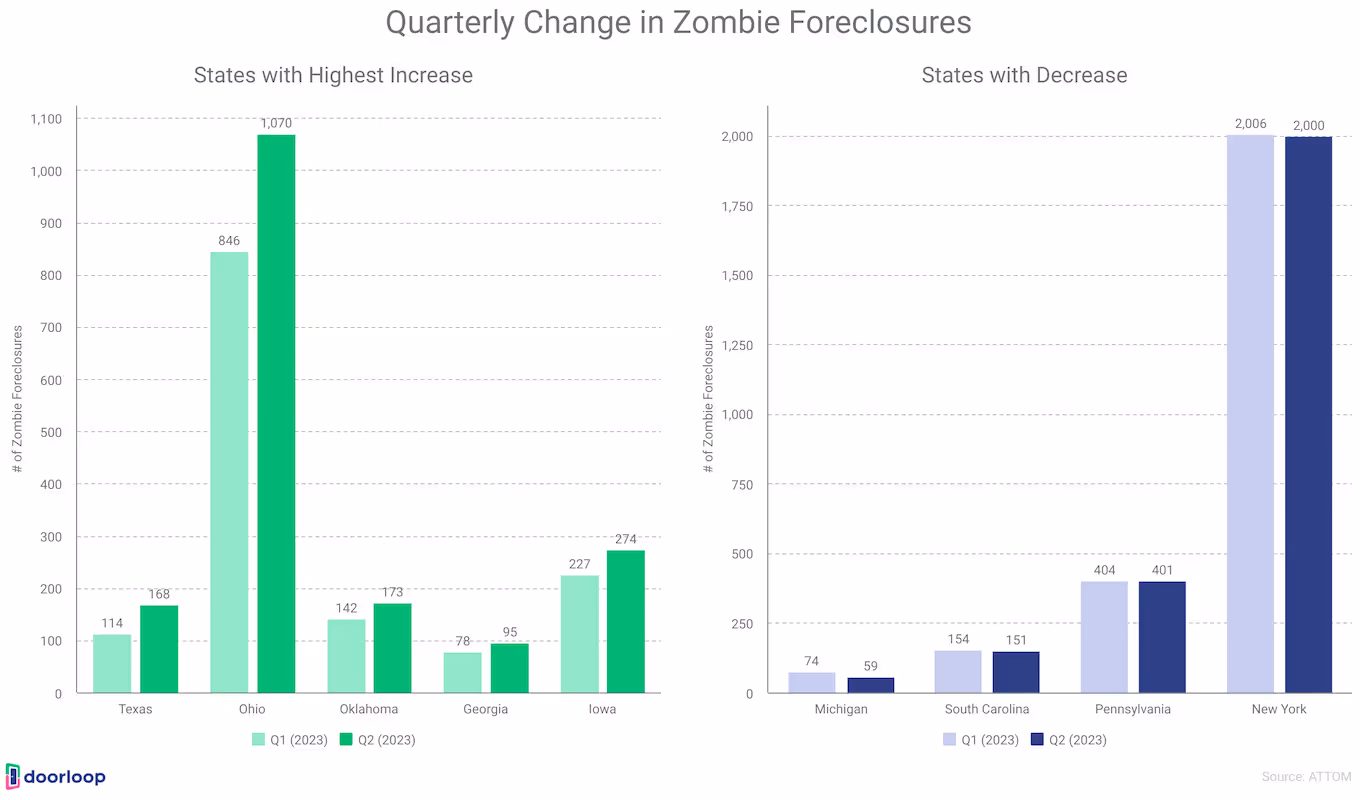
- Among the 311,508 pre-foreclosure properties, 8,752 are zombie foreclosures. Zombie foreclosures are abandoned pre-foreclosure properties. This number has grown since early 2022. The figure for the second quarter is 7.5% higher than the first quarter and 15.6% higher than it was last year.
- The total stock of residential properties in the U.S. is 101.3 million. Despite the higher rate of zombie foreclosures, the figure is still considered low as it has little impact on the nation’s total stock of residential properties.
- In May 2023, there were a total of 16,191 foreclosure prevention actions. Permanent loan modifications account for about 39% of these foreclosure prevention actions.
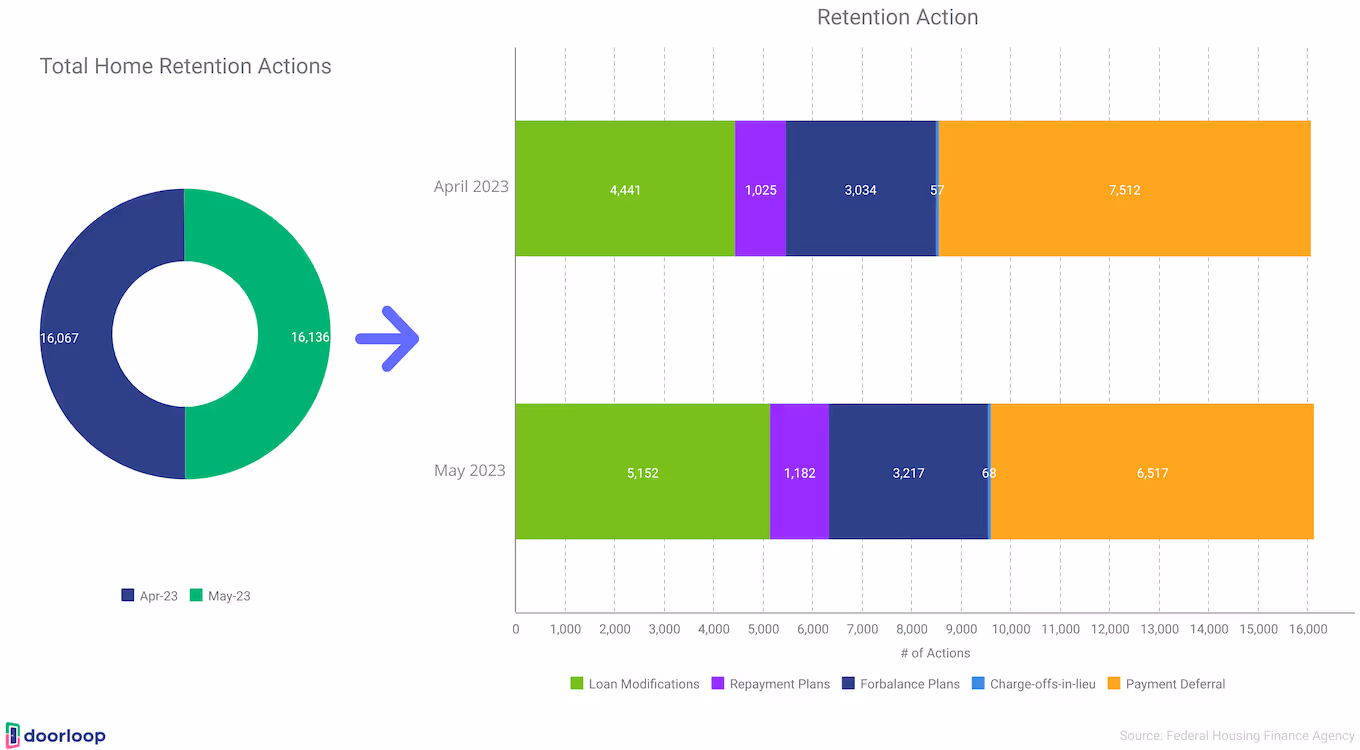
- There were a total of 16,136 home retention actions in May 2023. Home retention is a type of loss mitigation that can save property investors thousands of dollars in foreclosure. The number of home retention actions in May is a bit higher than it was in April, which was 16,067.
- There were only 55 home forfeiture actions in May. Forfeiting ownership is a way for investors to avoid the foreclosure process. The number of home forfeiture actions in May is somehow lower compared to April with a total of 65 actions.
- There were about 16 deed-in-lieu of foreclosure in May 2023 as well. Deeds-in-lieu is a way to avoid foreclosure by voluntarily transferring the title of the property to the lender. In April, there were only 13 deeds-in-lieu.
- There were a total of 1,270 third-party and foreclosure sales in May 2023. Freddie Mac accounts for 465 of foreclosure sales and Fannie Mae has a total of 805 foreclosure sales. In April, there were only a total of 1,188 third-party and foreclosure sales.
- At the same time, there were a total of 6,125 foreclosures that started in May. This number is 9% higher than it was in April, which was 5,604.
- At the end of the first quarter of 2023, there were a total of 58,268 recorded foreclosure prevention actions. These efforts helped about 6,066,666 families and individuals stay in their homes.
- There were a total of 58,120 home retention actions during the first quarter of 2023. Payment deferrals account for 27,069 of home retention actions. This is followed by 15,500 loan modifications, 12,324 forbearance plans, 3,069 repayment plans, and 158 charge-offs-in-lieu.

- The total number of home forfeiture actions during the first quarter of 2023 is 148. Most of these home forfeiture actions were short sales with a total of 103. This is followed by 45 deeds-in-lieu.
- The total number of REO inventory at the end of Q1 in 2023 is 11,190. This number is higher compared to the total number of REO inventory in the previous quarter (10,997).
- The total number of foreclosure starts during the first quarter of 2023 was 19,809. This is 6% higher than it was during the fourth quarter of 2022–18,693. At the same time, third-party and foreclosure sales increased to 3,700–12% increase from 4Q22, which was 3,297.
- An average of less than 1% of homeowners sell their previous homes to avoid possible foreclosure. Only 2% of homeowners between ages 43 to 57, however, avoid foreclosure by selling their homes. The three primary reasons for selling the previous home are to move closer to family and friends (21%), retirement (11%), and less desirable neighborhoods (11%).
Foreclosures During the Great Recession
The Great Recession, which started in 2007 and lasted for several years, did not only affect financial firms. It also affected people of all ages and groups, displacing millions of families and individuals from their homes. Here are some foreclosure information during the Great Recession:
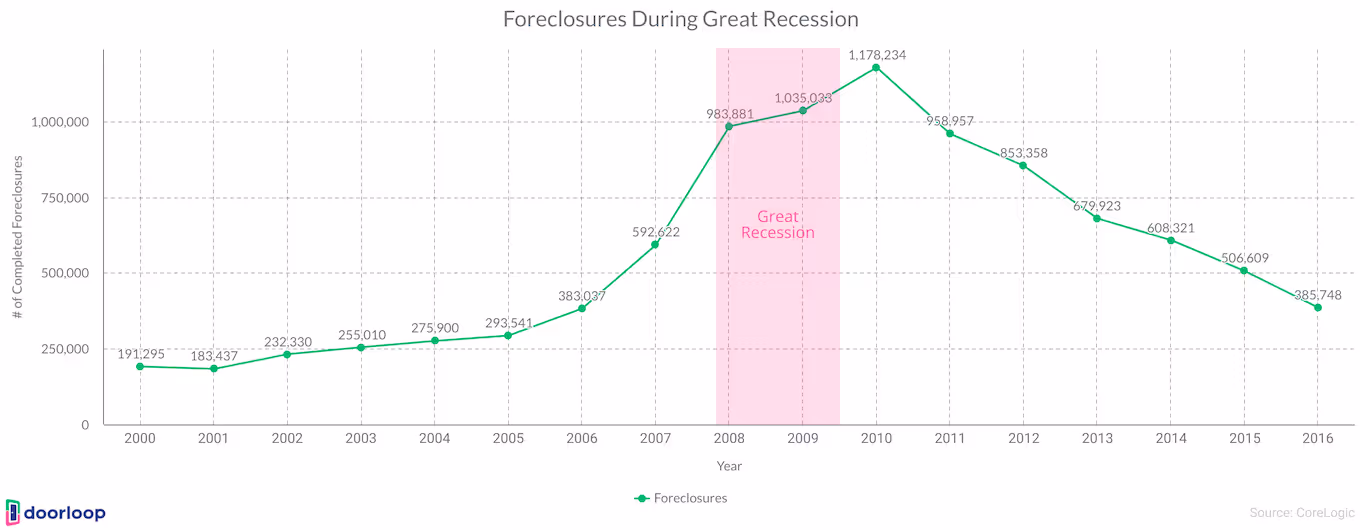
- The year 2010 has the highest number of completed foreclosures with a total of 1,178,234. The total number of completed foreclosures started rising between 2007 and 2009–the Great Recession period. In 2006, there were only 383,037 completed foreclosures. In 2007, the number rose to 592,622 and reached 983,881 in 2008. In 2009, the total number reached 1,035,033.
- In 2010, 1 in 33 homeowners faced foreclosures, displacing millions of families with children. In the subprime mortgage crisis during the Great Recession, 2.3 million children were living in homes undergoing foreclosure, and 3 million families with children were living in homes at serious risk of foreclosure.
- Approximately 38% of all foreclosures during the Great Recession were on rental properties. About 3 million families with children faced eviction or were evicted from rental properties suffering from foreclosure.
- One in 45 or more than 1.6 million children were homeless during each year of the Great Recession (2007 to 2008). As the waves of foreclosure increased during the recession, more than 14% of households with children were overcrowded between 2009 and 2011.
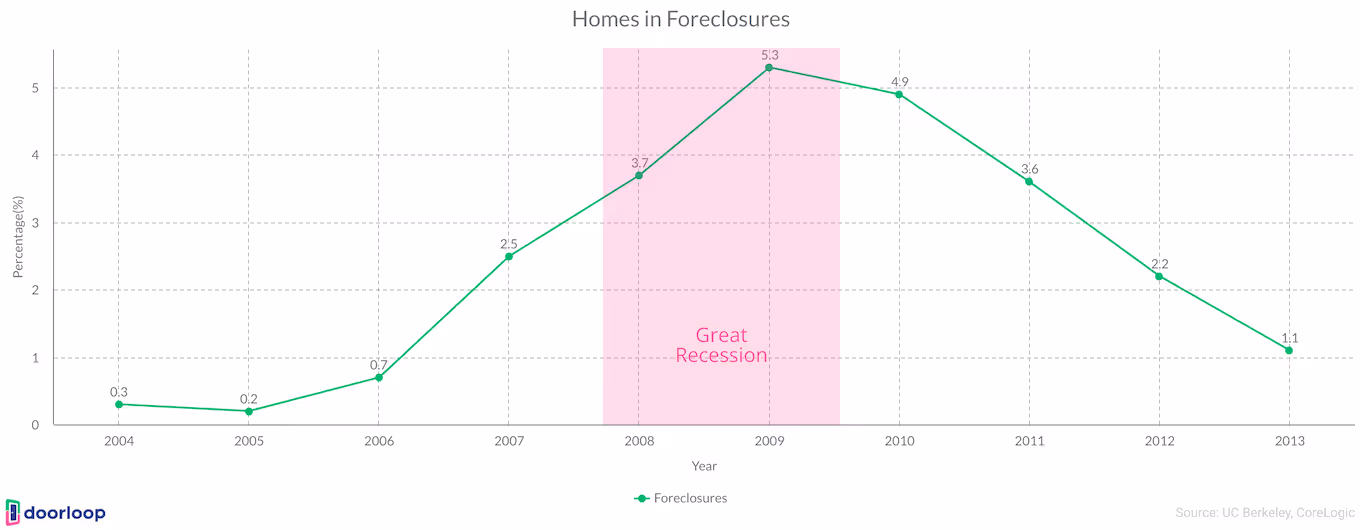
- During the subprime lending and foreclosure crisis, over 5% of all homes in Inland Empire were in foreclosure with Riverside and San Bernardino counties having nearly 6 and 3.5 times larger foreclosure rates than neighboring Los Angeles County. With these rates, the Inland Empire became known as the “foreclosure capital” of the nation.
- About 31.7% of Hispanic borrowers’ and 28.6% of Black borrowers’ homes went into foreclosure during the Great Recession. Black and Hispanic homeowners were the primary victims of predatory subprime mortgages leading up to the Great Recession.
The Effects of the Pandemic on Homeowners, Landlords, and Renters
Aside from health issues, the pandemic became a huge catalyst in homeownership. Its effect on the real estate industry is highly significant. Here’s how the health crisis affected homeowners, landlords, and renters:
- In 2020, 28,900,000 to 39,900,000 renters were at risk of eviction due to the COVID-19 pandemic. Before the pandemic, 20.8 million or 47.5% of renter households were already struggling with rent. When the pandemic began, 10.9 million or 25% of renters spent over 50% of their income on monthly rent.
- In 2020, 65% of properties with 2 to 4 units and 61% of properties with 5 to 19 units have a mortgage. About 44% of single-family rental owners had a mortgage or similar debt they struggled to pay for and were at risk of foreclosure and bankruptcy.
- The lack of rental income placed rental property owners at risk in 2020, especially “mom-and-pop” landlords, who own about 58% or 22.7 million single-family and duplex rental homes. These “mom-and-pop” landlords, also called individual investors, don’t have access to lines of credit that might help them prevent foreclosure.
- In January 2021, about 1.12% of homeowners feared foreclosure. When the pandemic started, approximately 5.57% of homeowners were behind on their mortgage payments, causing 1.12% or 890,000 homeowners to fear foreclosure of their homes.
- A total of 8.5 million loans had been in forbearance at some point during the pandemic. Forbearance is an agreement or an assurance that the lender will not start the foreclosure process for a limited period. About 2% of loans were in active loss mitigation, and 5% were either in active foreclosure or delinquent.
Issues With Mortgages
The risk of foreclosure starts when a borrower starts struggling with their mortgage payments. Mortgage loans are secured by collateral–your home. Having issues with mortgages can lead to foreclosure. Here are some figures to know about mortgages:
- About 63.8% of defaulters reported unexpected expenses as the primary trigger for mortgage default. This is followed by job loss (56.4%), payments on other large debts (44.3%), illness, disability, or death (43.3%), change in mortgage payments (31.9%), divorce or separation (18.4%), business failure (15.2%), retirement (4.1%), and payments on other mortgages (3.1%).
- The mortgage delinquency in December 2022 was 3% and the foreclosure rate was 0.3%. All things considered, these rates remained low throughout 2022. The foreclosure rate for the second half of 2022, however, is slightly higher compared to the previous six months of the same year.
- By January 2023, 2.8% of mortgages, including those in foreclosure, were delinquent by at least 30 days or more. Compared to the overall delinquency rate in January 2022, the January 2023 rate represents a 0.5% point decrease.
- The serious delinquency rate–loans that are 90 days or more past due, including loans in foreclosure, in January is down to 1.2%. Compared to January 2022, the serious delinquency rate was 1.2 down from 1.8%.
- The rate of Fannie Mae single-family loans in serious delinquency has decreased to 0.58% in April 2023 from 0.59% in March 2023. Serious delinquency is defined as loans that are 90 days or more past due or in the foreclosure process. The rate of serious delinquency for single-family loans continued its decline during Q2 of 2023. Aside from Fannie Mae, Freddie Mac had a slight decrease in serious delinquency as well with 0.62% in March to 0.61% in April.
FAQs
How many foreclosures in the USA in 2023?
There were a total of 185,580 U.S. properties with foreclosure filings–135,065 of these just started the foreclosure process. The number of bank repossessions also increased to a total of 22,672 properties during the first half of 2023. As of July 2023, foreclosures and short sales account for 2% of total existing home sales.
Which state has the highest foreclosure activity?
If we’re looking at the data during the first half of 2023, Maryland tops the list with up to a 100% increase in foreclosure activity. Aside from Maryland, Oregon (99%), Alaska (95%), West Virginia (83%), and Arkansas (72%) have seen significant increases in foreclosure activity as well.
Which state has the quickest foreclosure process?
As of Q1 2023, Wyoming holds the shortest average time in terms of foreclosure process with 111 days. This is followed by Minnesota with 141 days, Montana with 143 days, Texas with 146 days, and Arkansas with 157 days.
What is the common foreclosure process?
There are two types of foreclosure processes–judicial and non-judicial. Non-judicial is the most common foreclosure process used. It’s predominantly used in 30 states, compared to judicial foreclosure, which is commonly used in 21 states. Some exceptions to take note of; Hawaii and the District of Columbia use both processes. New Mexico allows non-judicial foreclosures on residential loans post-2006. Colorado and Maryland, despite being non-judicial predominant, require court supervision.
How to prevent foreclosure?
Foreclosure can be prevented in a lot of ways. During the first quarter of 2023, there were 58,268 recorded foreclosure prevention actions. These efforts helped about 6,066,666 families and individuals stay in their homes. These included a total of 58,120 home retention actions, such as loan modifications, repayment plans, forbearance plans, charge-offs-in-lieu, and payment deferrals. There’s also a total of 148 home forfeiture actions, such as short sales and deeds-in-lieu. The best way to prevent foreclosure, however, is to pay your monthly mortgage dues.
Sources
- nolo.com
- urban.org
- corelogic.com
- ssrn.com
- blackknightinc.com
- huduser.gov
- cnbc.com
- jchs.harvard.edu
- files.stlouisfed.org
- belonging.berkeley.edu
- nar.realtor
- fhfa.gov
- attomdata.com
- fanniemae.com
- gao.gov
- papers.ssrn.com
- scholarlycommons.law.case.edu
- siepr.stanford.edu
Frequently Asked Questions