


The U.S. property management industry employed 466,100 professionals in 2024 and contributed 13.9% to U.S. GDP through the broader real estate and rental sector in Q2 2025. The industry remains highly fragmented across over 102,000 private establishments, with median annual pay reaching $66,700 in May 2024 while cost pressures from labor, insurance, and regulatory compliance continue reshaping operations.
This analysis covers workforce size and wages, revenue dynamics, portfolio benchmarks, rental market conditions, technology adoption, geographic distribution, and the industry outlook through 2034.
Key Takeaways
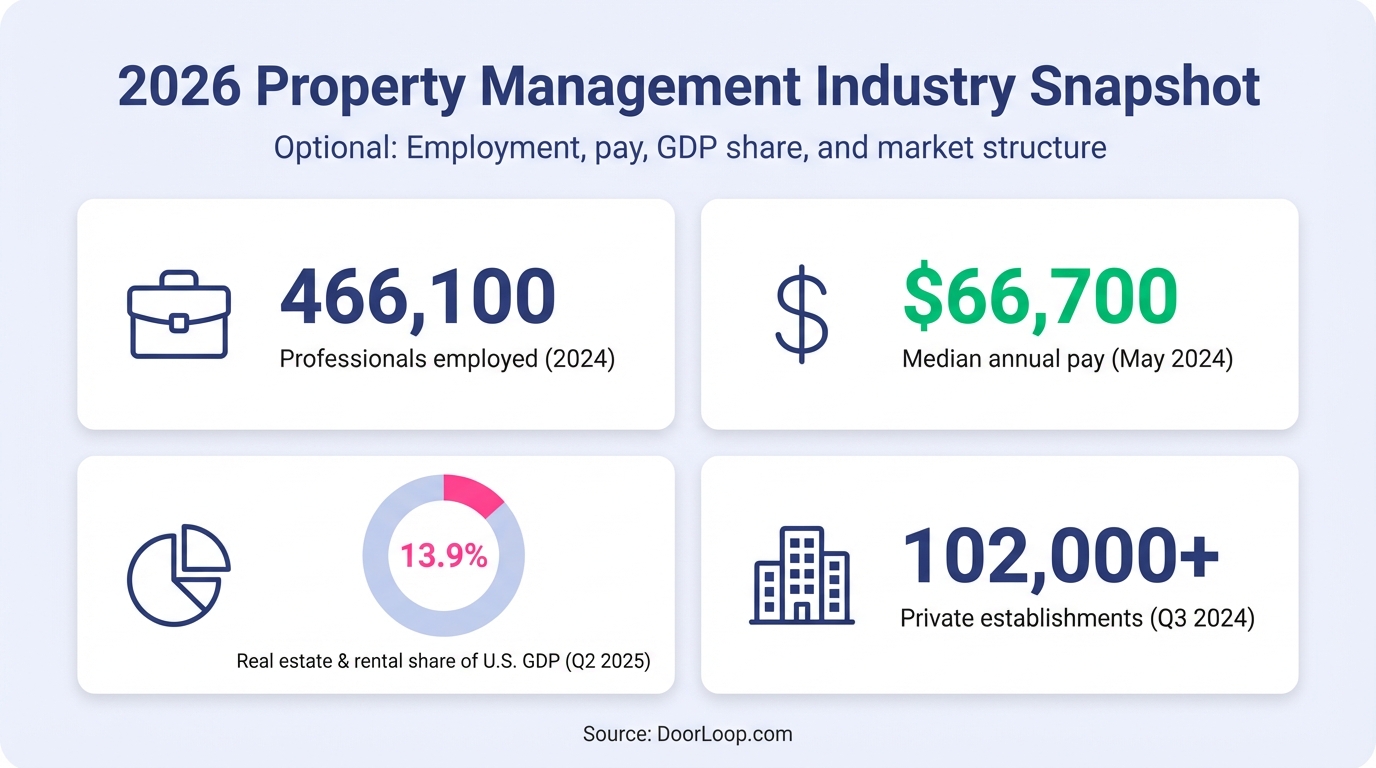
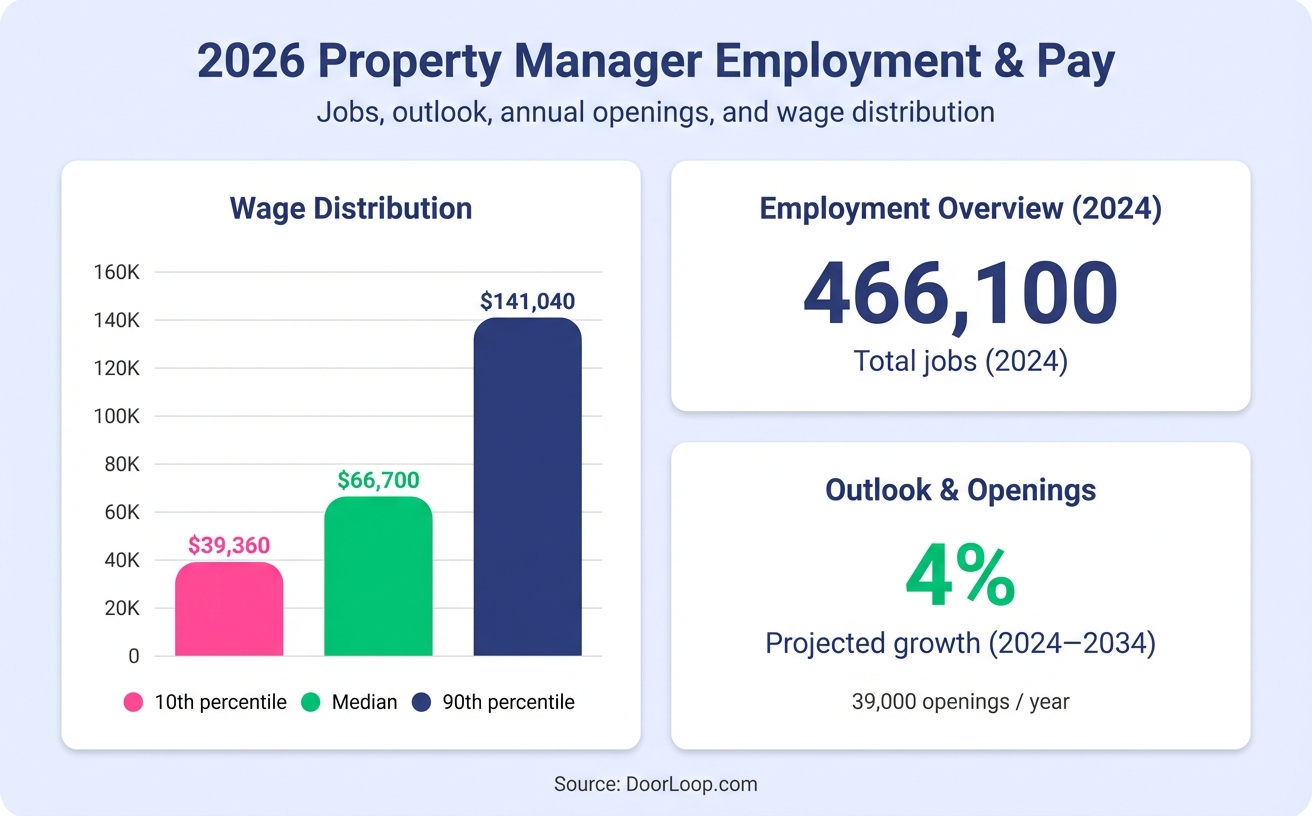
- The property management industry employed 466,100 professionals in 2024, with a projected 4% growth through 2034
- Median annual pay for property managers hit $66,700 in May 2024, with top earners exceeding $141,000
- The U.S. property management sector includes over 102,000 private establishments, reflecting a highly fragmented market
- Real estate and rental services contributed 13.9% to U.S. GDP in Q2 2025, underscoring the sector's economic significance
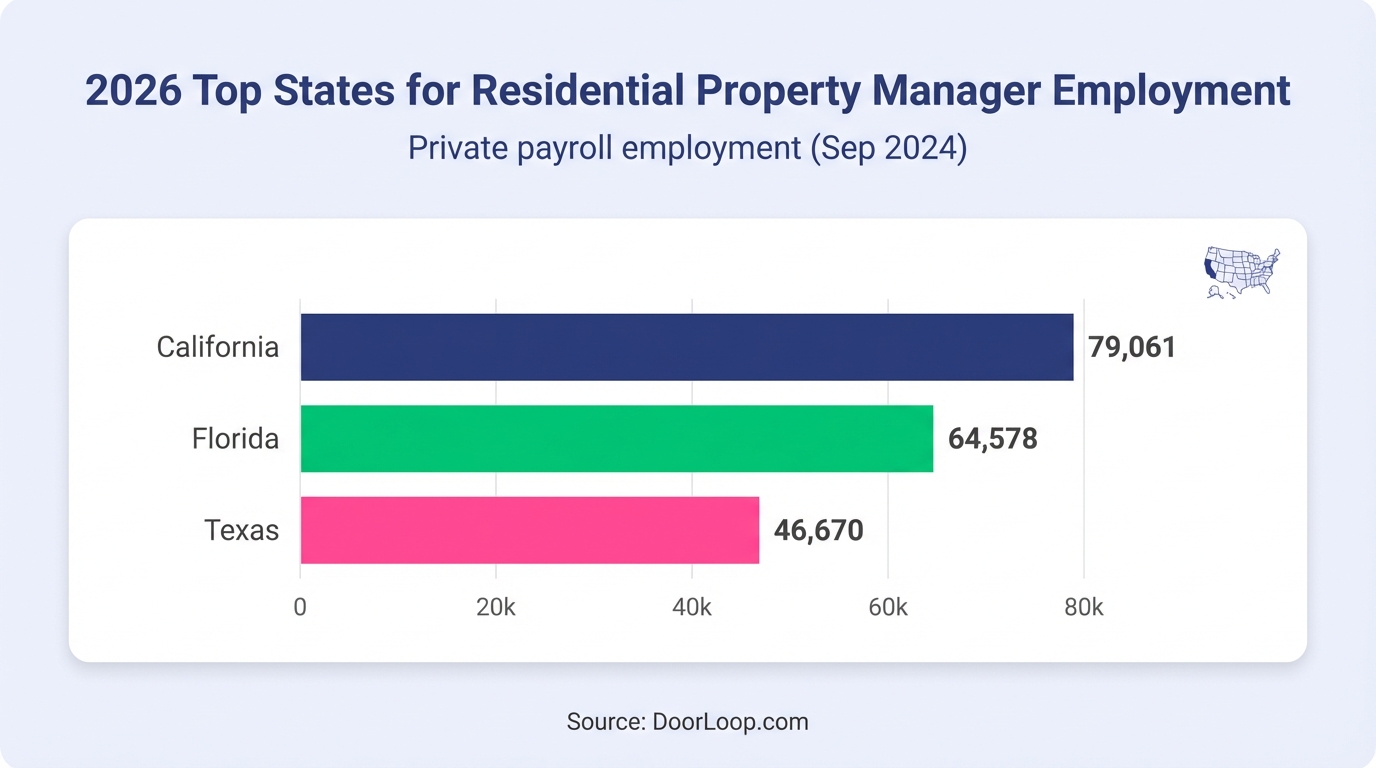
- California, Florida, and Texas lead in residential property manager employment, with California employing over 79,000 professionals as of September 2024
- Rental market conditions vary dramatically by region, with apartment vacancy rates ranging from 8.9% to 11.4% in major markets during 2024-2025
- Technology adoption accelerates as labor constraints push firms toward automation and digital workflows
Property Management Market Size and Growth
Property management sits at the heart of one of America's largest economic sectors. In Q2 2025, real estate and rental services accounted for 13.9% of U.S. GDP—a massive slice that reflects both the scale of rental housing and the complexity of managing properties professionally.
The industry's growth isn't just about buildings or square footage. Labor demand, technology adoption, and economic forces push property managers to deliver more service with fewer resources, creating constant pressure to optimize operations.
What makes tracking this market complicated is fragmentation. Unlike industries dominated by a handful of players, property management spreads across tens of thousands of companies. The Bureau of Labor Statistics reports over 102,000 private establishments in the real estate property management category as of Q3 2024. The "industry" is really thousands of independent operators, regional firms, and a few national companies all competing for the same tenants and owners.
The growth trajectory through 2034 appears modest but stable:
- 4% projected employment growth from 2024 to 2034
- Approximately 39,000 job openings per year driven primarily by replacement needs
- Steady rental demand supporting consistent staffing levels
- Geographic variation with Sunbelt states adding jobs faster than legacy markets
Market size matters less than market structure when you're operating a property management business. The fragmentation means there's no single playbook—fee structures vary, service levels vary, technology adoption varies. For property managers trying to benchmark operations, the relevant comparison happens locally rather than nationally. The operators who move faster and automate intelligently capture market share regardless of portfolio size.
This brings us to the question of who dominates the market and whether consolidation changes the competitive landscape.
Largest Property Management Companies
The property management industry doesn't have a "big three" the way tech or airlines do. Instead, fragmentation defines the competitive environment—over 102,000 establishments spread across the country, most managing fewer than 100 units.
A handful of national firms manage substantial portfolios and set the tone for technology adoption, service standards, and fee structures. These companies also absorb smaller operators through acquisition, slowly consolidating a market that has historically resisted scale.
When you examine state-level employment data, the concentration becomes clear:
California leads with 79,061 residential property managers on payroll as of September 2024, followed by Florida with 64,578 and Texas with 46,670.
The fragmentation creates opportunity for smaller operators. Firms that invest in automation and move quickly can compete effectively against companies ten times their size. Speed, service quality, and operational efficiency often matter more than brand recognition in local markets. An operator managing 200 units with modern software and streamlined workflows can outperform a 2,000-unit firm still relying on spreadsheets and manual processes.
While company size and market concentration provide context, the real financial story emerges when you examine revenue structures and cost pressures across the industry.
Property Management Industry Revenue and Profit
Revenue and profit in property management come down to a straightforward equation: units managed multiplied by fee percentage, minus the cost to deliver service.
The challenge? Costs keep rising while fee structures stay relatively flat. Labor represents the biggest expense, and wages for property management professionals increased steadily through 2024. The median annual wage hit $66,700 in May 2024, but compensation represents just the starting point. Benefits, training, turnover costs, and administrative overhead add substantially to the true cost per employee.
The Bureau of Labor Statistics tracks pricing pressures through the Producer Price Index for real estate services, which measures what property managers can charge relative to input costs. The December 2025 PPI release (scheduled for January 30, 2026) will offer the latest snapshot of pricing pressure across the industry.
For most operators, profit margins depend on two factors: portfolio size and operational efficiency. Firms managing fewer than 100 units often struggle to achieve economies of scale. Every vacancy, every late-night maintenance call, every manual accounting task eats into already-thin margins. Meanwhile, firms that automate tasks via property management software (e.g. rent collection, maintenance tracking, and owner reporting can manage larger portfolios without proportionally increasing staff.
The inflation environment of 2024-2025 created additional pressure across multiple expense categories:
- Insurance costs surged in many markets, particularly Florida and coastal regions
- Maintenance and repair expenses climbed as labor shortages pushed contractor rates higher
- Technology and software costs increased as firms invested in automation to offset labor constraints
- Regulatory compliance added administrative burden in markets with new tenant protection laws
Cost pressures don't always pass cleanly to owners or tenants, which squeezes margins further. An owner hiring a property manager at 10% of rent expects consistent service regardless of whether your insurance premium doubled or contractor rates jumped 25%. The operators who survive expense inflation are the ones who reduce manual work, automate workflows, and track every dollar with precision.
What separates profitable firms from struggling ones isn't just fee percentage—it's cost control through operational efficiency. With labor representing the largest expense category, workforce metrics and compensation trends directly impact your ability to scale profitably.
Employment and Salary Statistics for Property Managers
The property management workforce is substantial and growing, though not explosively. Understanding employment trends helps you benchmark staffing costs and hiring strategy against national norms.
Workforce Size and Job Growth
Property, real estate, and community association managers held 466,100 jobs in 2024 according to the Bureau of Labor Statistics. The workforce spreads across residential, commercial, and community association sectors, with residential management accounting for the largest share.
The 10-year outlook shows 4% projected growth from 2024 to 2034—slightly slower than the average for all occupations. The BLS forecasts approximately 39,000 job openings per year over the period, driven primarily by replacement needs as experienced managers retire or transition out of the field.
Job growth concentrates in markets with strong rental demand and new construction. Sunbelt states—Florida, Texas, Arizona, Georgia—continue adding property management jobs as populations shift and rental inventory expands. Legacy markets in the Midwest and Northeast see more stable or flat employment levels.
For property managers trying to hire, this presents an ongoing challenge. Demand for experienced professionals consistently outpaces supply, particularly in fast-growing markets. Firms that can't offer competitive pay or modern tools lose candidates to operators who can.
Median Pay and Wage Ranges
The median annual wage for property managers hit $66,700 in May 2024. The median masks significant variation across experience levels, property types, and geographic markets.
The bottom 10% of earners made less than $39,360, while the top 10% exceeded $141,040. Portfolio size, property type, geographic market, and years of experience all drive the range. Managers overseeing large commercial portfolios or luxury residential properties typically earn significantly more than those managing small apartment complexes. Location matters—managers in high-cost coastal markets command higher salaries than those in lower-cost regions.
For employers, the wage data reveals a labor market that rewards efficiency. If you're paying median wages but asking staff to manage portfolios manually—chasing late rent, tracking maintenance on spreadsheets, reconciling bank accounts by hand—you're going to lose talent to firms that automate those tasks with a QuickBooks integration and let staff focus on high-value work like owner relations and tenant retention.
With labor costs established as the primary expense driver, the next question becomes what firms charge for services and how fee structures align with operational costs.
Property Management Fees and Services
Fees vary widely across the industry, making simple benchmarks difficult. What you charge depends on property type, portfolio size, service scope, and local market dynamics.
Typical Management Fee Percentages
Most residential property managers charge between 8% and 12% of collected rent as their base management fee. The percentage covers core services: rent collection, tenant communication, maintenance coordination, and basic financial reporting.
Portfolio size drives fee variation in predictable ways:
- Smaller portfolios (under 20 units) often command higher percentages because fixed costs don't scale down proportionally
- Mid-size portfolios (20-100 units) typically fall in the 8-10% range as operational efficiency improves
- Larger portfolios (100+ units) often negotiate lower percentages but generate higher total revenue
A firm managing 500 units at 7% earns substantially more than a firm managing 50 units at 10%, even though the percentage is lower. The larger portfolio benefits from economies of scale in staffing, technology, and vendor relationships.
Common Add-On Fees
Base management fees rarely cover the full cost of service delivery. Most firms charge additional fees for specific tasks to align revenue with actual work performed for leasing workflows:
- Leasing fees: Typically 50% to 100% of one month's rent for finding and placing a new tenant
- Renewal fees: Often $100 to $300 per lease renewal to cover paperwork and coordination
- Maintenance coordination fees: Some firms charge a percentage markup on contractor work (usually 10% to 15%)
- Inspection fees: Move-in, move-out, and periodic property inspections often carry separate charges
- Late fee collection: A percentage of collected late fees (typically 20% to 30%)
The most profitable firms don't just charge higher fees—they deliver more value per dollar spent. Automating rent reminders reduces late payments. Online rent collection reduces late payments. Online maintenance requests reduce phone calls. Owner dashboards reduce reporting work. When you eliminate manual tasks, you deliver better service at lower cost, which creates pricing leverage.
Fee structures set revenue expectations, but operational efficiency determines actual profitability. The benchmarks you track internally reveal whether your business operates efficiently or burns money on preventable problems.
Portfolio and Operations Benchmarks
Running a profitable property management business requires tracking the right metrics. Portfolio and operations benchmarks tell you whether you're operating efficiently or losing money on preventable problems.
The key question isn't "how many units do I manage?" It's "how many units can each staff member effectively manage while maintaining service quality?"
Industry benchmarks suggest one full-time property manager can handle approximately 100 to 150 residential units, depending on property type and service scope. Scattered single-family homes require more travel and coordination than a concentrated apartment complex, reducing the effective units-per-manager ratio.
Firms using modern property management software often push those ratios higher—200 or even 250 units per manager—because automation handles rent collection, payment reminders, maintenance tracking, and routine tenant communications. The software eliminates hours of manual work each week, allowing staff to focus on complex problems and relationship management.
Beyond units-per-manager, other critical benchmarks include:
- Late payment rate: Top-performing firms keep late payments under 5% of total rent collected through automated reminders and online payment options
- Maintenance response time: Average time from tenant request to work order assignment (best-in-class firms respond within 24 hours)
- Tenant retention rate: Annual renewal percentage (65% to 75% is typical; above 80% is excellent)
- Vacancy rate: Portfolio-wide percentage of vacant units (holding under 5% separates strong operators from struggling ones)
- Turnover cost per unit: Total expense to prepare and re-lease a unit (tracking this reveals whether you're spending $500 or $5,000 per turn)
The operators who grow profitably obsess over these numbers. They track them monthly, identify outliers, and fix root causes rather than symptoms. A high late-payment rate might signal poor tenant screening, inadequate payment reminders, or too much friction in the payment process. A low retention rate might indicate maintenance delays, poor communication, or market-rate pricing that falls behind comparable properties.
Technology dramatically impacts these benchmarks. Online rent collection reduces late payments. Automated maintenance workflows reduce response times. Tenant portals reduce phone calls and emails. The firms that invest in the right software stack see measurable improvements across every operational metric.
While internal benchmarks reveal operational health, external market conditions determine whether your vacancy rates and rent growth align with local trends or signal deeper problems.
Rental Market Statistics for Property Managers
The rental market context shapes everything you do as a property manager—vacancy rates, rent growth, tenant demand, and lease terms all affect operations and profitability.
National averages mask dramatic regional variation. HUD's market spotlights illustrate this clearly:
In Q1 2025, the Fayetteville housing market area showed an apartment vacancy rate of 8.9% with average rents at $1,180 (up 3% year-over-year). Meanwhile, Tucson's Q3 2024 data revealed an 11.4% apartment vacancy rate with average rents at $1,177 (down approximately 1% year-over-year).
The statistics represent operational realities, not abstract data points. An 11% vacancy rate means more aggressive marketing, faster lease-up timelines, and potentially lower rents to stay competitive. An 8% vacancy rate with rising rents creates the opposite dynamic: you can be more selective with tenant screening and push rents higher without losing qualified applicants.
Rental market conditions also drive tenant behavior in predictable ways:
- In tight markets with low vacancy and rising rents, tenants hold onto units longer, increasing renewal rates
- In softer markets, tenants move more frequently, chasing deals and concessions, which drives up turnover costs
- New construction delivery affects absorption rates and competitive positioning across comparable properties
The best property managers track local market data monthly and adjust strategy accordingly. They monitor new construction permits, absorption rates, and comparable rents within a three-mile radius. They know when to push rent increases and when to prioritize retention over revenue growth.
Rental market statistics also inform owner conversations. When an owner asks why you're recommending a 2% rent increase instead of 5%, you point to local vacancy trends and recent lease-up timelines at comparable properties. Data turns subjective conversations into objective decisions.
As market conditions shift, technology becomes the lever for maintaining service quality and operational efficiency regardless of external pressures.
Technology Statistics in Property Management
Technology adoption in property management is no longer optional—it's a competitive requirement driven by labor constraints and tenant expectations.
The clearest signal comes from workforce math. With median wages at $66,700 and job openings consistently exceeding qualified candidates, firms that rely on manual processes hit a ceiling quickly. You simply can't hire enough people to handle 500 units the way you handled 50.
PropTech—property technology—fills the gap left by labor scarcity. Online rent collection eliminates manual payment processing and reduces late payments through automated reminders. Digital maintenance requests create a paper trail, reduce phone calls, and let tenants submit issues with photos attached. Tenant portals handle routine questions (lease terms, payment history, move-out procedures) without consuming staff hours through messaging workflows.
The shift toward digital payments accelerated dramatically over the past five years. Tenants expect to pay rent the same way they pay for everything else—online, instantly, from their phone.
AI and automation push further into operations each year:
- Automated lease renewal reminders reduce manual outreach while improving renewal rates
- Rent increase letters generate automatically based on market data and lease terms
- Maintenance follow-ups track work order status without requiring staff intervention
- Owner reporting compiles financial data and performance metrics without manual data entry
The financial impact is measurable. Firms using modern property management software typically report:
- Faster rent collection: Online payments arrive days or weeks earlier than checks
- Lower late-payment rates: Automated reminders reduce forgetfulness and procrastination
- Reduced staff workload: Routine tasks handled by software free up 10 to 20 hours per week per employee
- Better tenant retention: Self-service portals and faster maintenance response improve satisfaction
The firms resisting technology aren't competing on service quality—they're competing on price alone. In a market where labor costs keep rising, competing on price becomes a losing strategy. Technology investment separates operators who scale profitably from those who hit growth ceilings and stagnate.
Technology adoption varies by market and firm size, but geographic factors also play a significant role in shaping where property management jobs concentrate and what those positions pay.
Geographic Property Management Statistics by State
Property management employment and wages vary dramatically by state, reflecting local rental market size, regulatory complexity, and cost of living.
States With the Most Property Management Jobs
California dominates property management employment with 79,061 residential property managers on private payroll as of September 2024. The state's population, rental inventory, and regulatory environment push many landlords toward professional management rather than self-management.
Florida follows with 64,578 property managers, driven by explosive population growth, high investor ownership rates, and a large vacation rental sector requiring professional coordination. Texas rounds out the top three with 46,670 property managers, reflecting strong job growth, steady in-migration, and a business-friendly environment encouraging rental property investment.
These three states alone account for a substantial portion of total industry employment, but they also represent very different operational environments:
- California: regulatory complexity (rent control, just-cause eviction, habitability standards) makes professional management almost mandatory for multi-unit owners
- Florida: coastal markets face hurricane risk and insurance challenges requiring specialized knowledge
- Texas: fewer regulations create more competition and thinner margins in many markets
Geographic concentration reflects where rental demand meets regulatory complexity and investor capital. Markets with all three factors—high rental demand, complex regulations, and institutional investment—support larger property management workforces.
Highest Paying States for Property Managers
While state-level wage data requires deeper analysis of BLS occupational employment statistics, the general pattern holds: high-cost coastal markets pay higher wages, while lower-cost interior markets pay less.
Property managers in New York, California, Massachusetts, and Washington typically earn well above the national median, reflecting both higher living costs and the complexity of managing properties in heavily regulated markets. Meanwhile, managers in Mississippi, Arkansas, and West Virginia earn below the median, consistent with regional cost-of-living differences.
For property managers considering relocation or expansion, geographic wage differences matter. A $70,000 salary in Austin, Texas goes significantly further than the same salary in San Francisco, even though the job responsibilities might be identical. Conversely, high-wage markets often offer more opportunities for specialization and premium service tiers commanding higher fees.
Geographic trends and current employment data provide context, but forward-looking projections reveal what the next decade holds for the industry.
Property Management Industry Outlook
The property management industry faces a stable but challenging decade ahead. The BLS projects 4% employment growth from 2024 to 2034, translating to approximately 39,000 job openings annually.
Growth stems from several converging factors. First, the rental population continues expanding as homeownership remains out of reach for many households. Second, aging property owners increasingly hire professional management rather than handling tenant coordination themselves. Third, institutional investment in single-family rentals creates demand for third-party management at scale.
Growth doesn't guarantee easy profits. Cost pressures persist across multiple categories:
- Labor costs keep rising faster than fee structures evolve
- Insurance premiums remain elevated, particularly in climate-vulnerable markets
- Maintenance expenses climb as contractor labor shortages drive hourly rates higher
- Regulatory compliance increases in many markets as tenant protection laws expand
Regulatory complexity increases in many jurisdictions. Rent control, just-cause eviction, habitability standards, tenant protection laws—the compliance burden grows heavier each year, pushing more owners toward professional management but also increasing the operational cost to deliver management services.
Consolidation will likely accelerate over the next decade. Larger firms with strong technology infrastructure and streamlined operations can absorb smaller portfolios profitably. Smaller operators face a choice: invest in technology and automation to compete, or exit the market through acquisition.
The winners over the next decade won't necessarily be the biggest firms—they'll be the fastest. The operators who automate ruthlessly, eliminate manual workflows, and deliver exceptional service without adding headcount will capture market share regardless of portfolio size. Technology separates survivors from casualties. Firms still relying on spreadsheets, manual rent tracking, and phone-based maintenance coordination will lose staff, lose tenants, and lose owners to competitors offering seamless digital experiences.
The industry outlook is stable, but stability doesn't guarantee profitability. Growth opportunities exist for operators who adapt to labor constraints, cost pressures, and tenant expectations. The question becomes whether you're building a business built for speed or one constrained by outdated processes.
---
The property management industry in 2026 rewards speed and efficiency above all else. The firms that automate operations, track the right benchmarks, and deliver measurable value to owners grow profitably. The ones clinging to manual workflows and outdated systems fall further behind each quarter.
If you're ready to operate faster, work smarter, and eliminate the busywork dragging down margins, DoorLoop is built for exactly this challenge. Our property management software automates rent collection, maintenance tracking, owner reporting, and tenant communication—so you can manage more units without adding headcount.
See it in action. Request a demo and discover how the fastest-growing property managers run their businesses.
Sources
- Bureau of Labor Statistics – Property, Real Estate, and Community Association Managers: Occupational Outlook Handbook
- Beautify Data – United States Number of Private Business Establishments in the NAICS 53131 Real Estate Property Managers Industry
- Beautify Data – US Number of Private Payroll Employment By State for the NAICS 531311 Residential Property Managers Industry in September 2024
- Bureau of Labor Statistics – Employment and Earnings Table B-3b (CES)
- YCharts – US GDP – Contribution of Real Estate and Rental and Leasing Industries
- Bureau of Labor Statistics – Producer Price Index Home
- Bureau of Labor Statistics – Producer Price Index – Real Estate Services
- HUD User – Slowing Job Growth and Softening Rental Market Conditions in the Tucson HMA
- HUD User – Strong Job and Population Growth and Balanced Housing Market Conditions in the Fayetteville HMA
- Bureau of Labor Statistics – Real Estate and Rental and Leasing: NAICS 531
Frequently Asked Questions