


Key takeaways
- The Commercial real estate market size in the U.S. reached $1.2 trillion per revenue in 2022.
- As of Q4 2022, shopping centers under construction in the U.S. reached 10.6 million square feet.
- In Q1 2023, the office sector vacancy rate increased by 19.0% from 20 bps in Q4 2022.
- In 2022, multifamily residential real estate accounted for around 41% of the total commercial property investment market.
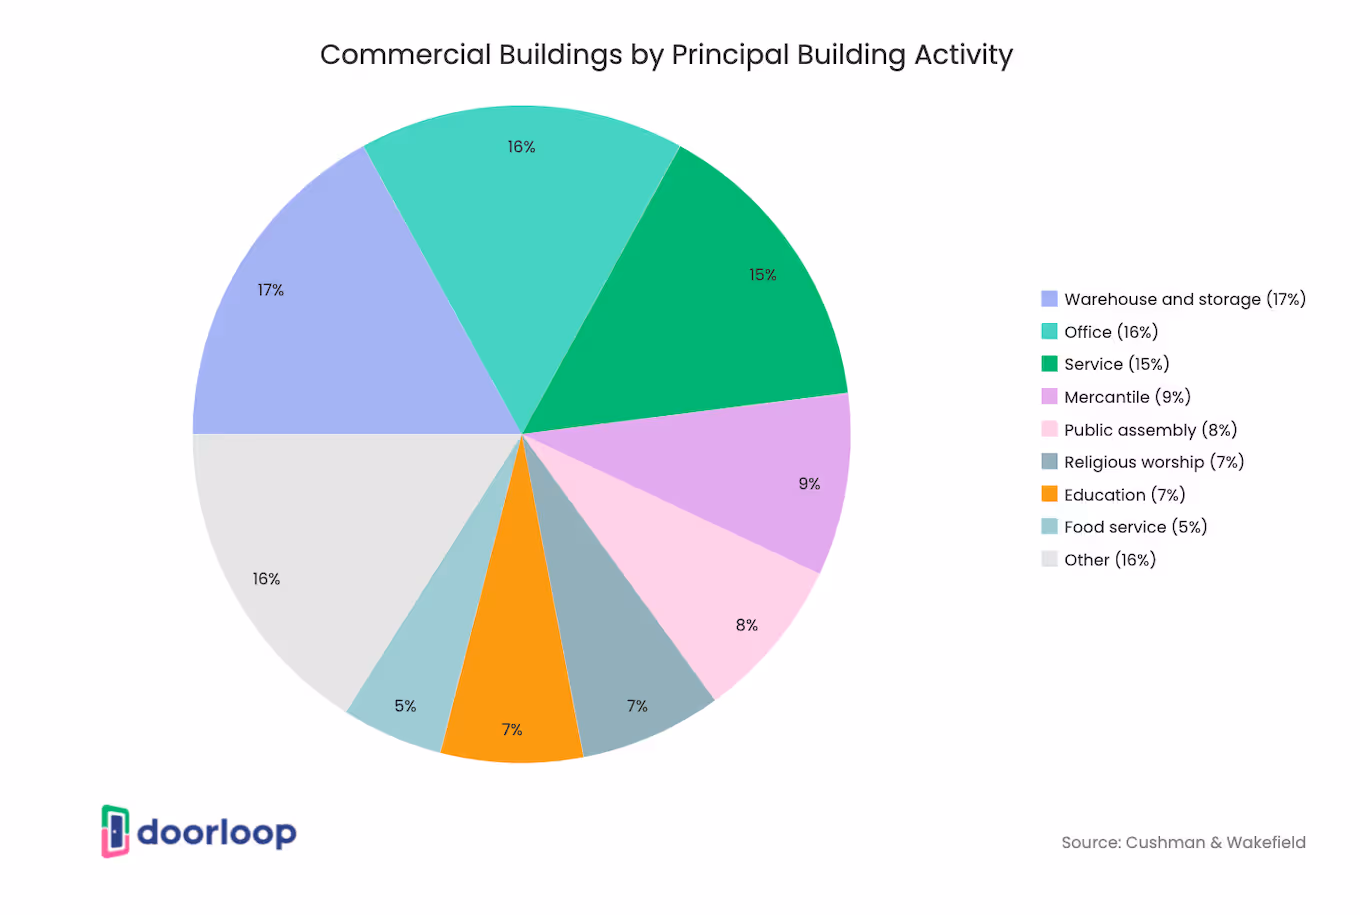
- Storage facilities and warehouses account for 17% of the overall U.S. commercial real estate buildings.
- In Q1 2023, the hospitality real estate sector had a revenue per available room (RevPAR) of more than 10% higher than how it was prior to the pandemic.
- Nashville had a 3.3% vacancy rate, with an average asking rent of under $26 per square foot (PSF) in 2022.
- San Francisco's office vacancy rate has increased significantly, soaring from 4% to 32%.
- Huntsville, Alabama’s total sales volume for the retail sector in Q3 2022 was $26,848,616, a drop from $99,346,872 year-over-year.
- The number of multifamily homes in the U.S. is projected to reach 155.25 million by 2023.
Research Summary:
The commercial real estate industry in the U.S. has long been known for its strength and volatility. Over the years, its susceptibility to various changes has significantly influenced its overall condition. Interest rates, economic conditions, global financial crisis, instability, and demographic trends have all played significant roles in driving or stunting its growth. Given its constant exposure to different headwinds, one may wonder whether this industry will face uncertainties or achieve remarkable success. Let’s examine the U.S. commercial real estate market performance more closely by exploring the insights from our data.
For easier access, we broke down the data in the following ways:
Market Overview | Competitive Landscape | Sectors | Best CRE Markets | Worst CRE Markets | State Trends by Sector | Forecast 2025
Market Overview
The commercial real estate market in the U.S. is a rapidly evolving sector that has undergone significant disruptions, hindering its growth in recent years. The Covid-19 pandemic, for instance, brought about profound societal transformations that have impacted the market. However, as the end of the pandemic comes into sight, we are already witnessing changes that are reshaping the landscape. These changes have resulted in noticeable shifts in the performance of U.S. commercial real estate. The statistics below provide insights into the current patterns in the American commercial real estate market.
- The Commercial real estate market size in the U.S. reached $1.2 trillion per revenue in 2022.
The growth rate of the commercial real estate market declined by 6% in 2022. Between 2022 and five years earlier, its market size also dropped by 0.6% yearly on average. The drop in its market size fell faster than the country’s
overall economy.
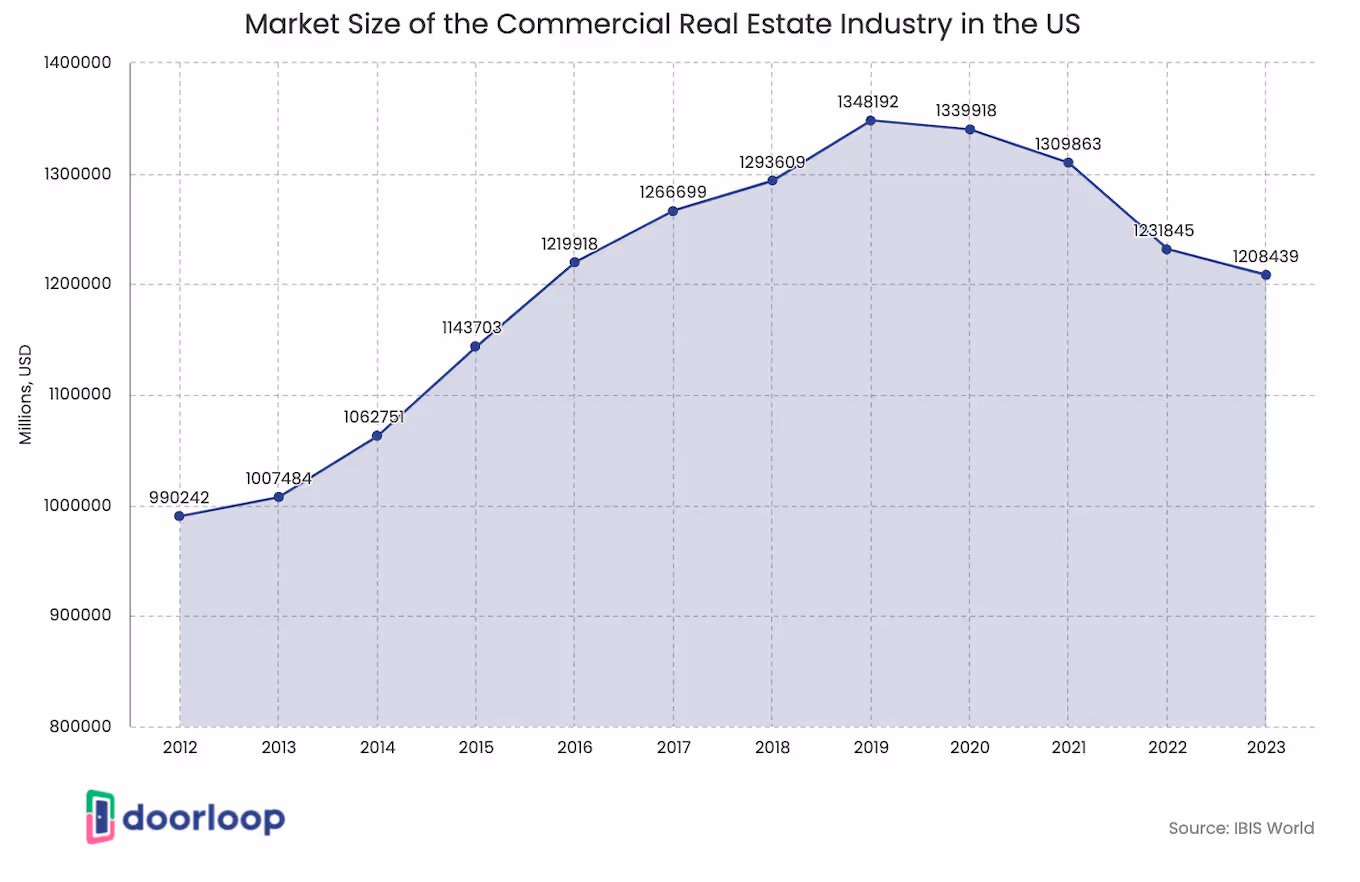
- The commercial real estate revenue declined at a CAGR of 1.4% to $1.2 trillion over the past five years.
The commercial real estate revenue has experienced a decrease, with a notable 1.9% drop in 2023 alone. Additionally, profit margins have reached 8.9%. Prior to the pandemic, commercial real estate has exhibited strength. The increasing value of private nonresidential construction equated to higher fees and total performance for operators in the commercial real estate industry.
- CRE revenue fell to $230.7 billion at a CAGR of 3.3% over the past five years.
The decline in CRE revenue includes a 0.4% drop in 2023 alone due to a 3.1% decline in profit. Before the pandemic, the revenue growth in the construction of commercial buildings was deemed an increasing corporate profit.
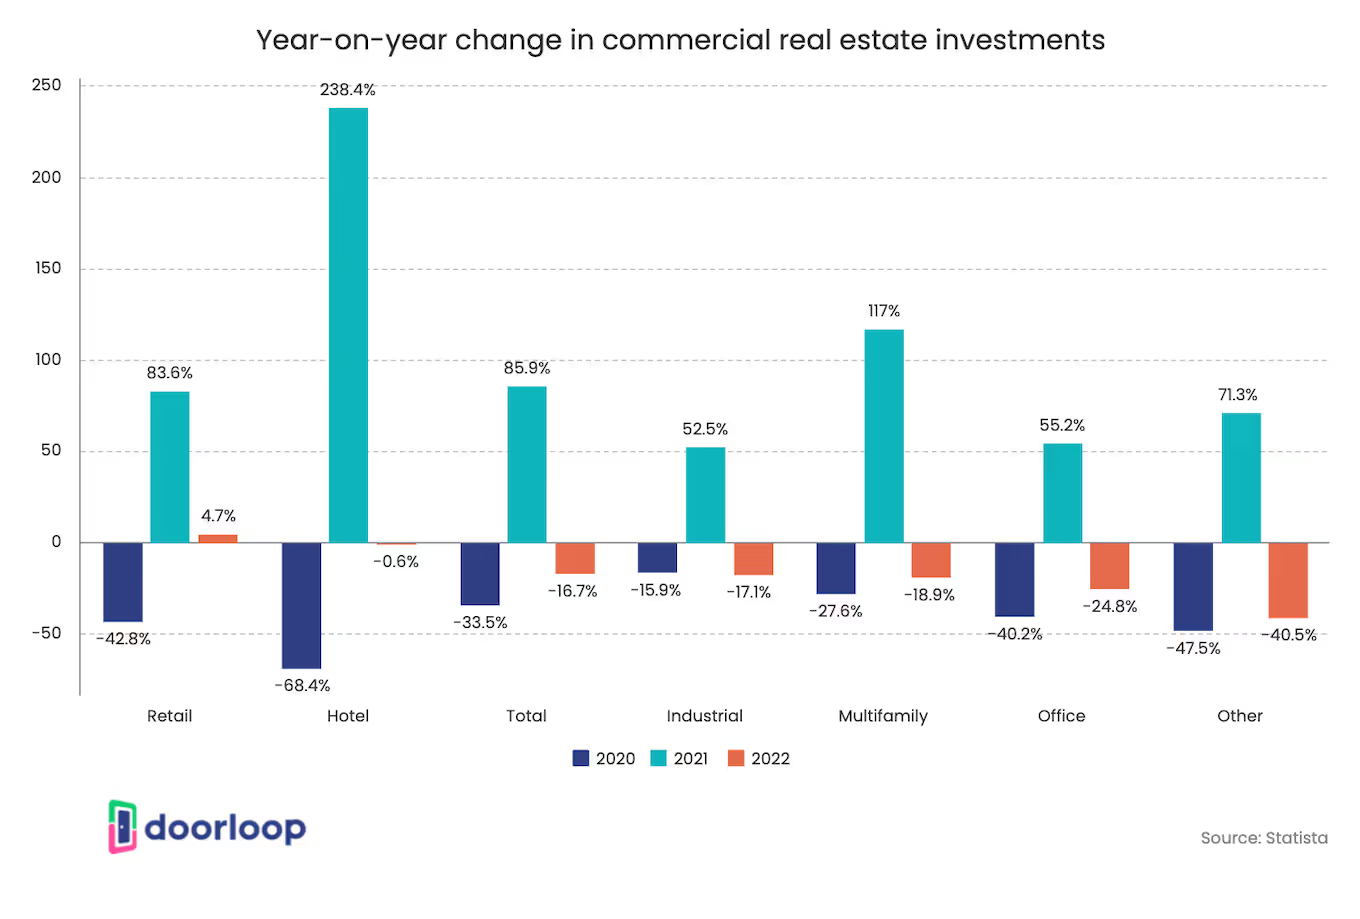
- In 2022, the total investment volumes in the commercial real estate market fell by 17%.
After experiencing a drastic increase in the investment value of American commercial real estate in 2021, following the effects of the pandemic in 2020, investments declined once again in 2022.
- It is, however, worth noting that investments dropped between approximately 1% and 41% across various asset classes.
💡 As market conditions evolve, having the right tools to manage diverse assets is essential. Explore DoorLoop’s commercial property management software capabilities to streamline leasing, maintenance, and accounting across your portfolio.
Sectors
Recent events have had a significant impact on the performance and overall status of the commercial real estate market in the U.S. In recent years, the industry has staggered through the path of challenges, with roadblocks such as fluctuations in sales volumes and rental rates, rising construction costs, and an economic downturn on its way. Interestingly, the performance of different sectors within the industry continues to vary, with some still struggling to recover from the pandemic while others are experiencing growth. To gain an understanding of the vast size and scope of the industry, let's examine some recent statistics on these sectors.
Retail
Retail real estate is one of the most pervasive and diverse sectors of America’s commercial real estate industry. In recent years, it has experienced annual growth, particularly with the increase in net commercial and retail square footage. Despite these improvements, the sector experienced rapid deceleration due to increased vacancy rates in malls triggered by the pandemic. As the world continues to recover from the pandemic's effects, retail real estate appears to be a stable venture for investors.
- As of Q4 2022, shopping centers under construction in the U.S. reached 10.6 million square feet.
It is worth mentioning that malls accounted for a total of 4.9 million square feet in overall retail construction.
- Across all retail properties in the U.S., the average square foot rent was $23.7 in Q4 2022.
General retail space refers to single-tenant freestanding commercial buildings with parking amenities, such as grocery stores, drugstores, and street-front urban retail stores. Malls, on the other hand, had $32.12 average square foot rent and had the priciest rental space among various types of retail real estate in the U.S.
- Malls had the highest vacancy rate of 8.7% across different types of retail properties in the fourth quarter of 2022.
Still, in 2022, the vacancy rate in general retail locations was 2.5%. In 2020 amidst the pandemic, there were increases in the vacancy rates of shopping center real estate in the U.S.
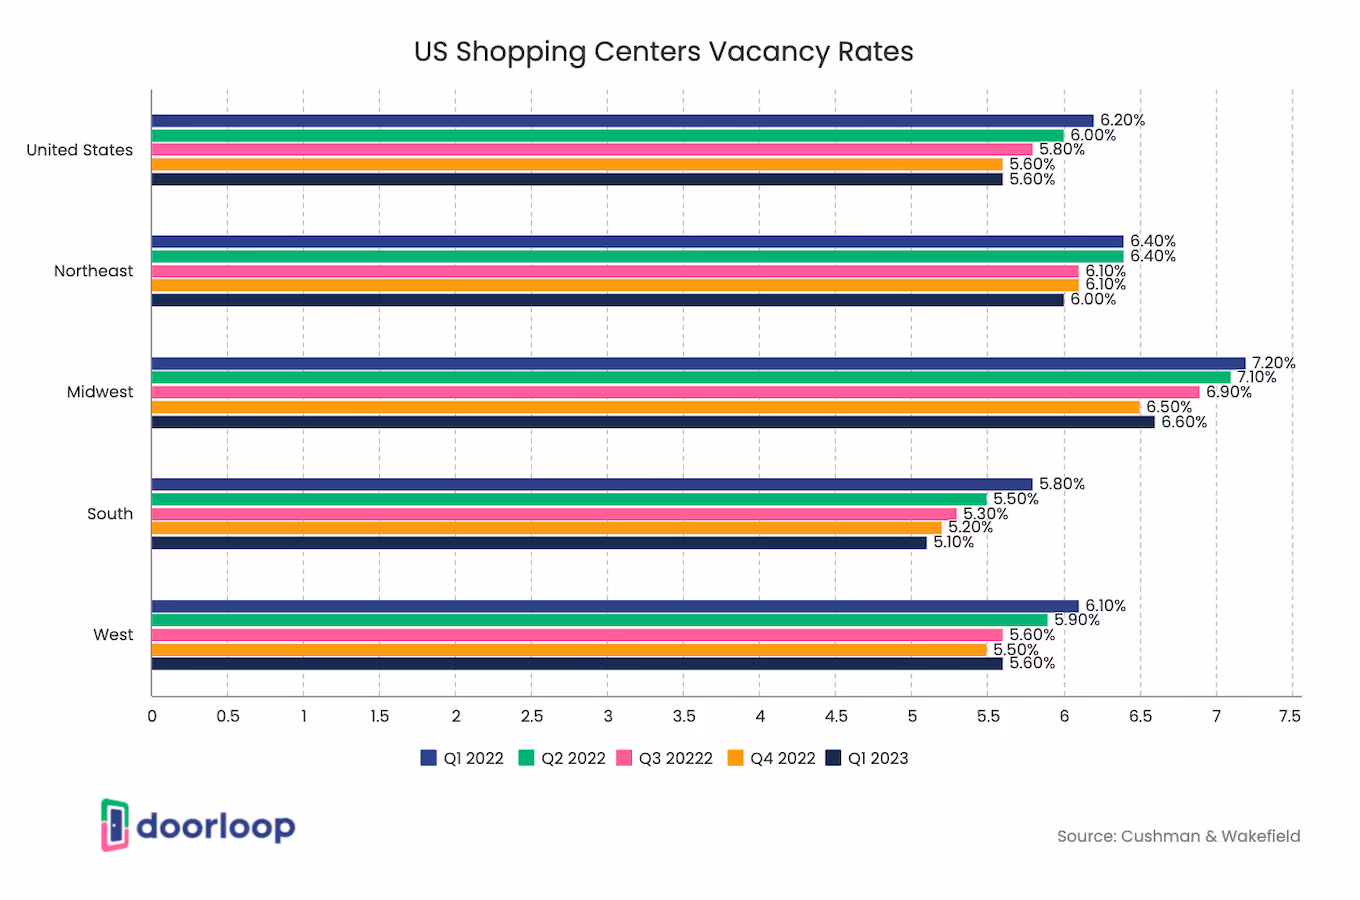
- In Q1 2023, the vacancy rate of shopping center real estate in the U.S. declined by 5.6%.
Texas/South Central was one of the regions in the United States with the highest vacancy rate early this year. Lower vacancy rates fell in areas, such as the Northeast.
- In New York, the highest construction cost for shopping center facilities was $473 as of late 2022.
On the other hand, Denver has had one of the lowest construction costs for shopping center facilities, averaging about $183 per square foot in 2022. It is worth noting that in the retail sector, renovations have become more common than new construction.
- In Q1 2023, the retail sector vacancy rate flatlined at 10.3% over the previous four quarters.
Additionally, the asking/effective rents slightly increased by 0.2%/0.3% in the fourth quarter of 2022. It is important to note that the asking/effective rents stayed within the range of $21/$18 per square foot - a figure that has remained unchanged since four years ago.
<table><tr><th></th><th>Q1 2023</th><th>Q4 2022</th><th>Q1 2022</th><th>Quarterly Change (from Q4 2022)</th><th>Annual Change (from Q1 2022)</th></tr><tr><td>Vacancy Rate</td><td>10.3%</td><td>10.3%</td><td>10.4%</td><td>0.0%</td><td>-0.1%</td></tr><tr><td>Asking Rent (per SF)</td><td>$21.52</td><td>$21.47</td><td>$21.40</td><td>0.2%</td><td>0.6%</td></tr><tr><td>Effective Rent (per SF)</td><td>$18.81</td><td>$18.76</td><td>$18.70</td><td>0.3%</td><td>0.6%</td></tr></table>
- In Q3 2022, the vacancy rate of the CRE retail sector declined 4.3% from 4.8% in the third quarter of 2021.
It is worth mentioning that the retail sector only accounts for 9% of the buildings and infrastructures in the overall CRE industry.
- The general retail space occupied approximately 6.4 billion of the overall 11.8 billion square feet of retail space in the U.S. in 2022
In the above-mentioned year, general retail space held a majority of the retail real estate stock in the U.S. It was the type with the lowest rate of vacancies.
- In the first quarter of 2023, the shopping center real estate in the South area reached 1.8 billion square feet.
Additionally, the Northeast area’s volume amounted to a little more than one-third or 621 million square feet. It is worth mentioning that the size of shopping center real estate inventory in square feet in Q1 2023 varied drastically through different regions across the U.S.
- At the onset of 2023 in the West, top rents amounted to $28.1 per square foot.
Between Q1 2020 and Q1 2023, shopping center real estate experienced a jump in the average monthly asking rent per square foot. There was uniformity in the trend across all regions in the U.S.
Office
Recently, some of the largest banks in the U.S. have identified office real estate as a sector of growing concern, due to declining property values, increasing interest rates, and a slowing economy. Experts suggest that certain office properties are currently facing the greatest refinancing risks. The sector closed down in 2022 in a downbeat manner, particularly due to work-from-home practices that left workplaces vacant and underused. It was the worst-performing sector in commercial real estate last year. To gain further insights, let's examine the data on how office commercial real estate has been performing.
- In Q1 2023, the office sector vacancy rate increased by 19.0% from 20 bps in Q4 2022.
Additionally, the office sector vacancy rate exceeded the pandemic peak of 18.5% due to oversupplied stock. For the 5th consecutive quarter, there was an increase in asking rates by 0.4% despite the surge in vacancies.
<table><tr><th></th><th>Q1 2023</th><th>Q4 2022</th><th>Q1 2022</th><th>Quarterly Change (from Q4 2022)</th><th>Annual Change (from Q1 2022)</th></tr><tr><td>Vacancy Rate</td><td>19.0%</td><td>18.8%</td><td>18.1%</td><td>0.2%</td><td>0.9%</td></tr><tr><td>Asking Rent (per SF)</td><td>$35.30</td><td>$35.16</td><td>$34.60</td><td>0.4%</td><td>2.0%</td></tr><tr><td>Effective Rent (per SF)</td><td>$28.13</td><td>$28.06</td><td>$27.65</td><td>0.2%</td><td>1.7%</td></tr></table>
- In the first quarter of 2023, the office sector reached a record-high vacancy rate of 12.9%, compared to 12.0% in the previous year.
Despite employer mandates for in-person work, demand for office space has been declining. Today, a number of businesses are adopting hybrid work arrangements, which allow a combination of in-person and remote work.
- In 2022, the office sector accounted for approximately 16% of the total commercial real estate investment market.
Office buildings accounted for 16% of the overall commercial real estate properties and are considered a common CRE investment due to their profitability.
- Dallas and Houston, Texas had a higher than 29% vacancy rate in the first quarter of 2022.
In 2022, more space stayed vacant than leased, especially in certain areas such as California, San Francisco, New York, and Manhattan.
- In Q3 2022, around 15.4% of office space across the U.S. was left vacant.
Since the pandemic, there had been a considerable part of the American workforce working remotely, particularly at home. Businesses have become hesitant in upscaling or renewing leases.
Multi-Family
The multifamily sector has experienced significant growth over the past few years. During times of economic uncertainty, multifamily real estate has been considered a safe investment choice due to the increased demand for its properties. This sector has remained a strong player in the overall commercial real estate industry and is an excellent choice for those seeking stable returns and protection against inflation. But how has the sector performed in the past year and beyond? Let's explore the following statistics to find out.
- In 2022, multifamily residential real estate accounted for around 41% of the total commercial property investment market.
In the U.S. there were about 473,000 multifamily house starts in 2021, with every housing unit having an average size of 1,046 square feet. In the same year, multifamily housing accounted for nearly 15% of the American housing stock.
- In Q1 2023, the multifamily sector had a net absorption of 82%, which was lower than the net absorption rate in 2022.
Further, its vacancy rate has jumped to 6.7% from 5.0% in 2022. This has led to a decrease in rent growth of over 8% points in one year.
- In Q3 2022, the multifamily vacancy rate was 5.4% - an increase from the previous year’s 4.7%.
In the third quarter of 2022, the multifamily vacancy sector had a 12-month rent growth of 5.7%, which was a drop from Q3 2021’s 10.4%. While multifamily owners and investors are susceptible to cost increases, they can make annual rent adjustments to deal with market changes.
- In Q3 2022, the vacancy rate in the multifamily sector had a slight increase of roughly 6%.
It is, however, worth noting that while that was a decrease, it was notably lower than the long-term historical average.
- In the third quarter of 2022, the cap rates in the multifamily segment have remained low at a national estimated level of 4.7%.
In the early phase of 2023, it was thought that the multifamily cap rates would increase above 5.0%, provided that there is an increase in the 10-year Treasury and moderation in investor demand.
- In 2021, the value of multifamily lending amounted to more than $487 billion.
In the same year, multifamily real estate accounted for 42% of the overall U.S. housing market. It was even bigger than the office sector.
Industrial
Despite the shock waves that Covid-19 has sent through the U.S. economy, certain sectors of commercial real estate are still performing well, and one of these is the industrial real estate market. The surge in e-commerce, a shopping practice induced by the pandemic, has increased the demand for warehousing and fulfillment centers, driving the upward trend of this sector. The industrial sector is expanding in the U.S., and foreign investment is expected to play a significant role in its further development. To better understand the industrial real estate market in the U.S., let's examine the insights from our research.
- Storage facilities and warehouses account for 17% of the overall U.S. commercial real estate buildings.
This includes infrastructures that are used for assembly production, manufacturing, research, warehousing, storage, and distribution.
- The vacancy rate of the industrial commercial real estate sector in Q3 2022 was 4.0%.
It was a drop from the vacancy rate of 4.5% in 2021’s third quarter. The sector’s 12-month rent growth from Q3 2021 to Q3 2022 was from 8.3% to 11.8%. In all of the sectors, industrial commercial real estate had the lowest vacancy rate at 4%.
- In Q1 2023, the industrial sector’s vacancy rate was at a low of 4.3%.
Additionally, the industrial real estate segment has continued to exhibit strength in 2023. Its rent growth rate has remained high at 10.3%, with warehouses having significant rent growth of 11.7%.
- By 2023, the industrial real estate demand is projected to increase from 850 million square feet to 14.8 billion square feet.
It is expected there would be a demand for industrial real estate driven by a double-digit increase in e-commerce sales. In previous projections, it was suggested there would be an additional 510 million square feet of new industrial real estate space in the market from 2020 and the previous year.
- In Q1 2023, industrial transactions reached $7.7 billion overall, trading at an average sale price of $133.77 per square foot.
The Inland Empire and Bay Area recorded more than $1 billion in sales in the first quarter of 2023. This shows that the industrial sector of commercial real estate in the U.S. has a strong performance.
- In March 2023, the national industrial in-place rents were on average $7.15 per square foot, up 7.1% from 2022.
St. Louis was the only metro to record a negative rent growth, falling 2.0% y-o-y. In the South, the most expensive market was Miami, with $9.61 per square foot as in-place rent.
- As of Q3 2023, there were 636.6 million square feet of industrial space under construction throughout the United States.
This was down to 742.3 million square feet in early 2023. Development in the Northeast is underway, spearheaded by Philadelphia, with 18 million square feet of space.
- In March 2023, industrial vacancy rates had a national average of 3.9%.
Further, only seven of the leading 30 industrial metros came in at a vacancy rate of 5.0% or more. However, it is worth noting that the demand for space may enter moderate levels as huge users take measures to deal with rising costs.
- In Q1 2023, there were approximately 127 million square feet of industrial space deliveries.
This has the potential to shatter 2022’s record of 489 million square feet of deliveries if such a pace continues. However, it is also predicted that completions will slow throughout the rest of the year.
Hospitality
The hospitality sector of the U.S. commercial real estate market is experiencing growth, fueled by factors like the rising interest in travel. The United States attracts a significant number of visitors from around the world, with certain cities witnessing particularly high visitor rates. Accommodation and hotels play a crucial role in the hospitality real estate sector, serving the needs of travelers and contributing to its overall success. To gain a better understanding of the real status of the hospitality real estate sector, let's examine the following statistics:
- In Q1 2023, the hospitality real estate sector had a revenue per available room (RevPAR) of more than 10% higher than how it was prior to the pandemic.
This sector actually had a further improvement in hotel revenue. As the pandemic is coming to an end, the demand for hospitality spaces is projected to increase throughout 2023.
- The volume of hotel real estate supply reached 5.56 million square feet in 2022.
This jump marked the second consecutive year of increase. It was also the highest figure recorded in seven years prior to 2022.
- In 2023, 51% of industry expert respondents highly recommended Miami as a place to purchase, hold, or sell a hotel property.
It’s further worth mentioning that 58% of respondents suggested holding onto the hotel property in Honolulu. Still, in 2023, 38% of respondents recommended Orlando as an ideal place to sell a hotel property.
- Fort Myers achieved the highest increase in hotel real estate investment of $1 billion in 2022.
The hotel real estate investment increase was a rise of 400% year-over-year. Greater Los Angeles received the largest investment volume, amounting to 3.8 billion U.S. dollars, between the fourth quarter of 2021 and the third quarter of 2022.
- In Q1 2023, the hotel sector experienced an increase in demand by 5.5% and 5.4% in occupancy.
There was an improvement in hotel fundamentals across the board year-over-year. While the supply growth was flat, there was a 15.5% revenue per available room (RevPAR) and 9.6% in average daily rate (ADR).
- Over the past five years, hotel construction revenue has exhibited an upward trend with a Compound Annual Growth Rate (CAGR) of 0.3%.
This improvement includes a rough estimate of a 1.9% increase in hotel construction revenue in 2023. Despite the limitations on demand brought about by the pandemic, there was an increase in demand for hotel construction services in 2021.
- The hotel construction revenue is projected to reach a total of $26.4 billion in 2023.
However, the same report has forecasted a drop in profit by 4.0% for the period between 2023 and 5 years earlier. The industry revenue growth was severely impacted by the pandemic, which led to a decline in profitability.
Other
- In 2021, the medical office national vacancy rate dropped by 10 basis points to 8.3%.
This is a favorable comparison to the broader office segment where there was an increase in vacancy to 14.8%.
- Medical office building total investment jumped from $11.9 billion in 2020 to $17.4 billion in 2021.
The aging population in the U.S. has fueled the outlook for properties of these kinds. With the medical office buildings market having high occupancy and resilience, investment is expected to grow.
- About 66% of investors believe that medical office buildings would be the biggest investment opportunity in 2023.
In 2022, healthcare transaction volume has reached roughly $26 billion. Medical office buildings, on the other hand, accounted for the largest portion of investment in the same year at 58%.
- By the end of 2022, the medical office had a resilient occupancy of 92.3%.
It also had steady rent and growth in net operating income (NOI). Nearly 90% of medical visits still happen in-person. This leaves telehealth declining to 10% of all visits, following a high of 54% during the pandemic.
- The annualized total transaction volume of the student housing industry reached $18.9 billion in 2022.
On a significant scale, it has surpassed the year-end high of $11.5 billion in 2021. Between 2021 and 4 years earlier, the cross-border capital held 20% and deployed nearly $10 billion to student housing assets.
- From Q4 2022 to Q1 2023, the occupancy rate in senior housing increased 0.3 points from 82.9% to 83.2%.
Plus, the occupancy rate jumped 5.4% overall points from a pandemic low of 77.8% in Q2 2021.
Best CRE Markets
The U.S. commercial real estate market is affected by various factors beyond Covid-19, such as interest rates, inflation, geopolitical events, and the potential of a global recession. The performance of cities and states differs widely, especially in terms of sectors. Some states are more attractive to investors due to their less expensive facilities, excellent income growth, reduced effective property tax rates, and good job opportunities.
For landlords and investors navigating high-demand markets like Nashville or Dallas, choosing the right tools to streamline operations is essential. Explore our curated list of the best softwares for commercial portfolios.
Now to better understand why certain cities are considered the best commercial real estate markets in the U.S., we have collected some statistics.
- Nashville had a 3.3% vacancy rate, with an average asking rent of under $26 per square foot (PSF) in 2022.
The median closed price for properties also increased to $386 PSF, a $40 increase from 2021. Nashville, a country-music hotspot, has a strong job market with increasing career opportunities, making it an attractive location for investors eyeing commercial real estate properties.
- The total commercial real estate (CRE) volume of the Dallas/Fort Worth metroplex was under $23 billion in 2022.
DFW, another hot favorite among investors, saw a 54% increase in its total volume from mid-2021. Texas is often considered a prime relocation destination by businesses and individuals leaving high-tax states, making it an attractive location for commercial real estate investment.
- Austin, TX had a 4.6% vacancy rate in 2022, with asking rent prices increasing by more than 11% year-over-year.
The retail market in Austin is particularly impressive to landlords, with an average of $28 to $29 per square foot (PSF) yearly and over 604,000 square feet of new construction underway. Additionally, the industrial property outlook in Austin remains strong, with 4.2 million square feet of net absorption in 2022.
- In 2022, the overall vacancy rate of Tampa/St. Petersburg, Florida was 4.3%.
The retail market in this area is primarily fueled by tourism, with an average asking rent for retail space of $22.28 per square foot (PSF), full-service gross. As of Q3 2022, the area had experienced 390,904 square feet of absorption, with an overall new construction of 143,550 square feet.
- The asking rates for Raleigh/Durham, North Carolina reached $11.13 in 2022.
The increase indicates a 3.5% quarter-over-quarter increase in the overall industrial market and warehouse, as well as flex property. Moreover, there was a 7.9% quarter-over-quarter increase in the asking rate for warehouses in the area.
- In 2022, the direct vacancies in Charlotte, North Carolina decreased to an average of 2.8% over 12 months.
Charlotte is undeniably one of the top 20 fastest-growing U.S. cities, with impressive net leasing absorption for the last six quarters. These figures have encouraged occupiers and investors alike to finance new developments in the area.
- In H2 2022, Miami, Florida's retail space had a low 3.1% vacancy rate.
The area's average asking rents were around $37 to $38 per square foot (full-service gross). During the same period, Miami experienced an absorption of 86,892 square feet, and its average retail asking prices increased by 20% year-over-year.
- The retail inventory space in West Palm Beach, Florida comprised 38,307,626 square feet in 2022.
Additionally, the area had an overall vacancy rate of 4.6% and $261 million in the third quarter of 2022 data. This popular destination for shoppers and tourists is expected to have an average asking rent of $30.85 per square foot (PSF) per year and currently has 96,334 square feet of new construction underway.
- In 2022, Orlando, Florida had a low 3.7% vacancy rate, with an industrial inventory of more than 140 million square feet (MSF).
As of 2022, the asking rents in the area were approximately $10.25 per square foot (PSF) for triple-net (NNN) leases. Moreover, in November 2022, the industrial property investment sales in Orlando, Florida reached $1.2 billion, with an average sale price of $145 per square foot (SF).
- Atlanta, Georgia saw approximately 1.4 million square feet (MSF) of new commercial real estate (CRE) leases in Q3 2022, contributing to a year-to-date total increase of nearly 62 MSF.
Additionally, the city experienced a 3.6% year-over-year increase in average asking rent during the same period, with the average asking rent reaching $31.05 per square foot (PSF).
Worst CRE Markets
The commercial real estate market has undergone significant changes, and some areas have been more favorable than others. Certain major cities in the United States have struggled more than others, depending on their critical economic drivers, making them unfavorable locations for commercial real estate investment. To gain a better understanding of why certain areas are considered the worst commercial real estate markets in the U.S., let's examine the figures below:
- San Francisco's office vacancy rate has increased significantly, soaring from 4% to 32%.
As a result, San Francisco is considered one of the worst cities for commercial real estate investment in 2023. Furthermore, the Bay Area experienced a population loss of 6.7% between July 2020 and July 2021, contributing to the challenging conditions in the commercial real estate market.
- New York's typical Class A building has an office rental cost of $80 per square foot, which is considered unreasonably expensive.
In addition to its commercial real estate rental crisis, the city also has one of the highest taxes in the country, with a combined sales tax rate of 9.25%.
- Hartford, Connecticut ranks 79th for investor demand, development opportunities, local economy, and availability of capital.
Additionally, its scores for these factors are low, with an overall poor investment outlook predicted for 2023. Specifically, its Investor Demand Score is 2.17 (Rank: 79), Development/Redevelopment Opportunities Score is 2.65 (Rank: 79), Local Economy Score is 2.42 (Rank: 80), and Local Public and Private Investment Score is 2.57 (Rank: 78).
- Providence, Rhode Island, ranked 73rd in investor demand and 72nd in opportunities for development/redevelopment.
This suggests that the city is undergoing difficulties in its commercial real estate (CRE) investment environment. Additionally, Providence ranked 71st in both availability of debt and equity capital. These low scores suggest that investors may encounter difficulties in finding profitable opportunities in the city.
- Baltimore ranked 76th in the local economy, 70th in local public and private investment, and 76th in the availability of debt and equity capital.
Ranking below average in these commercial real estate (CRE) investment factors suggest that investors may face challenges in finding profitable opportunities in the city's CRE market.
Competitive Landscape
The American commercial real estate industry is fiercely competitive, and with ongoing economic uncertainty, industry leaders are prioritizing certain strategies to maintain a precarious balance. As the industry adapts to the new normal, competition is expected to intensify. The following insights provide a glimpse into the competitive landscape of the U.S. commercial real estate industry.
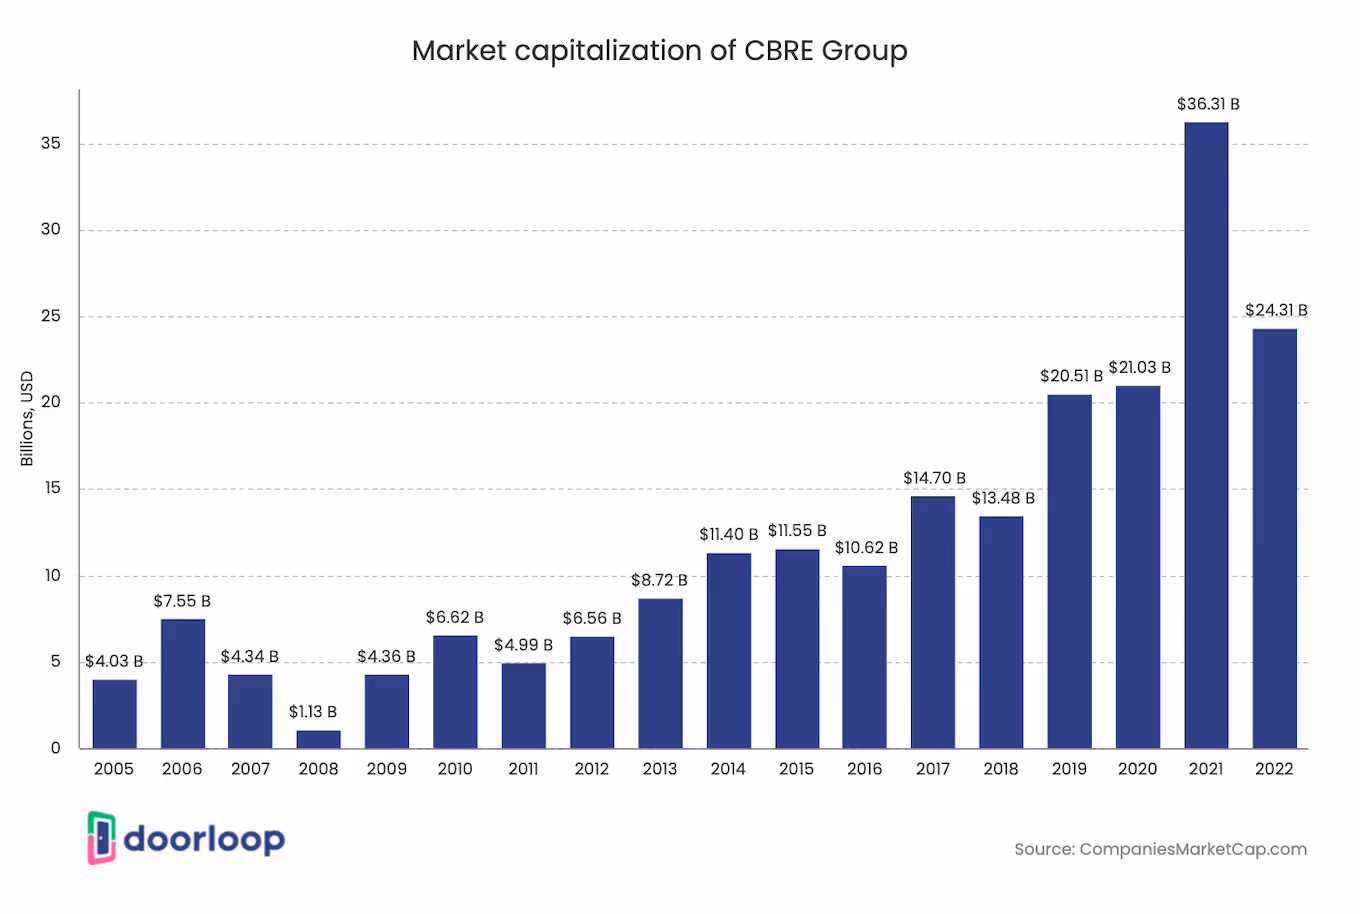
- As of June 2023, CBRE Group’s market cap is $24.45 Billion.
This American commercial real estate services and investment firm has a current revenue of $30.90 billion. In 2022, it had a revenue increase of $30.82 billion over 2021’s $27.74. Further, its earnings in 2023 reached $1.50 billion.
- The market cap of Cushman & Wakefield is $2.04 billion as of June 2023.
This American company is one of the world’s largest commercial real estate services firms. Cushman $ Wakefield’s current revenue is $10.02 billion, which is a drop from its revenue of $10.10 billion in 2022. When it comes to its earnings, it currently has $0.37 billion.
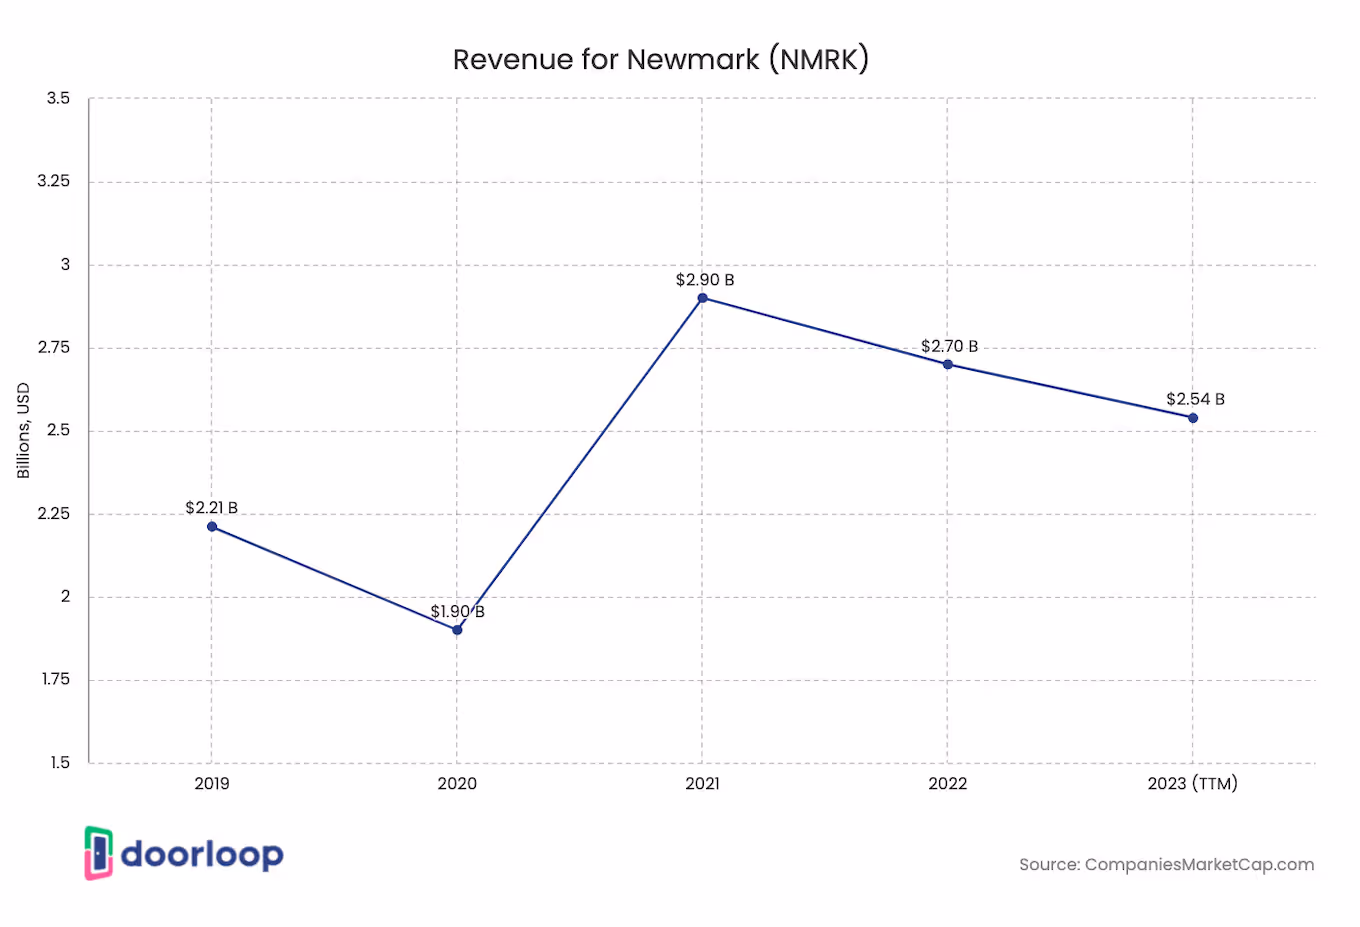
- In June 2023, Newmark Group Inc. generated revenue of $2.54 billion.
This is down from its revenue of $2.70 billion in 2022 and $2.90 billion in 2021. It is worth mentioning that this commercial real estate advisory and services firm currently has a market cap of $1.48 billion as of June 2023.
- The June 2023 revenue of Marcus & Millichap is $1.13 billion.
In 2022, Marcus & Millichap had revenue of $1.30 billion, up from $1.29 billion in 2021. This American company that specializes in providing mortgage brokerage, real estate brokerage, research, and advisory services has a market cap of $1.25 billion as of June 2023.
- Simone Property Group (SPG) has a current revenue of $5.34 billion.
Headquartered in Indiana, this American real estate investment trust made a revenue of $5.29 billion in 2022 - a decrease from its $5.11 billion in 2021. Its earnings of $3.29 billion in 2022 was a drop from $3.52 billion in 2021. As of June 2023, Simone Property Group has a market cap of $41.24 billion.
- Franklin Street Properties has a market cap of $0.16 billion in June 2023.
Currently and in the previous year, the company has a revenue of $0.16 billion. In 2021, it generated a revenue of $0.20 billion. The earnings of Franklin Street Properties amounted to $0.14 million as of June 2023.
- As of June 2023, the market capitalization of Jones Lang LaSalle is $7.21 billion.
The revenue of this leading commercial real estate professional services firm this year is $20.77 billion, down from its revenue of $20.86 billion in 2022 and up from $19.36 billion in 2021. Earnings generated by JLL in June 2023 amounted to $0.79 billion.
- In June 2023, the generated revenue of Colliers International (CIGI) amounted to $4.42 billion.
In 2022, Colliers International’s revenue was $4.45 billion - an increase over its revenue of $4.08 billion in 2021. In June 2023, the market cap of Colliers International is at $4.42 billion and its earnings amounted to $0.31 billion.
- Savills (SVS.L) has a market cap worth $1.63 billion in June 2023.
This global commercial real estate services provider has a network of more than 35,000 individuals. In 2021, Savills generated a revenue of $2.89 billion - an increase from the @2.37 billion in 2020.
- In June 2023, RE/Max had a market cap of $0.56 billion.
Still, in June 2023, the revenue of RE/Max is $0.34 billion - a slight drop from its revenue of $0.35 billion in 2022. This year, the company’s earnings totaled $39.18 million, an increase from the $39.03 million it generated in 2022.
State Trends By Sector
The development and overall status of commercial real estate in the U.S. are closely linked to the economy and the performance of different market segments. The coronavirus pandemic has impacted the commercial real estate market, with e-commerce driving the need for more warehouses and fulfillment centers, leading to growth in the industrial and retail sectors. Moreover, the hospitality segment has thrived as a result of the protocols brought about by the pandemic. However, the office sector still faces challenges, while multifamily real estate has performed better than pre-pandemic times. The statistics below provide insights into the performance of various commercial real estate sectors in different states:
- Huntsville, Alabama’s total sales volume for the retail sector in Q3 2022 was $26,848,616, a drop from $99,346,872 year-over-year.
In the same duration, the metro area’s vacancy rate also fell from 3.3% to 2.7%. Its inventory SF increased from 27,210,145 to 27,472,090.
- The vacancy rate in Tucson, Arizona's office sector decreased slightly from 10.6% in Q3 2021 to 9.8% in Q3 2021.
During the same period, the total sales volume increased significantly from $48,364,460 to $81,412,328. Moreover, the market cap rate remained steady at 8.5% from Q3 2021 to Q3 2022.
- The multi-family vacancy rate in Denver-Aurora-Lakewood, Colorado increased from 5.8% in Q3 2021 to 6.6% in Q3 2022.
During the same period, the inventory units in the area increased from 265,892 to 274,591. The market cap rate in the area remained consistent at 4.2% from Q3 2021 to Q3 2022.
- In Q3 2022, the total sales volume of the industrial sector in Bridgeport-Stamford-Norwalk, Connecticut was $36,618,376, which was a significant drop from Q3 2021's figure of $181,023,872.
Despite the decrease in sales volume, the area's vacancy rate improved from 5.9% in Q3 2021 to 5.0% in Q3 2022. However, the market cap rate in the area increased slightly from 7.2% in Q3 2021 to 7.3% in Q3 2022.
- In Dover, Delaware's office sector, the market cap rate increased to 9.2% in Q3 2022, which was a significant jump from the 8.9% recorded in Q3 2021.
During the same period, the total sales volume in the area decreased from $5,781,761 to $1,325,000, while the vacancy rate improved slightly from 12.9% in Q3 2021 to 12.2% in Q3 2022.
- In Q3 2022, the multifamily vacancy rate in Atlanta-Sandy Springs-Alpharetta, Georgia increased significantly to 7.6%, up from 5.4% in the same quarter of the previous year.
During the same period, the area's inventory units increased from 470,450 to 481,857, while the market cap rate experienced a slight drop from 4.6% to 4.5%.
- Urban Honolulu, Hawaii's retail sector vacancy rate improved from 4.8% in Q3 2021 to 4.2% in Q3 2022.
During the same period, the area's market cap rate increased from 4.8% to 4.9%, while the total sales volume dropped significantly from $48,414,884 to $26,317,240. The weaker demand for retail space in the area is attributed to the slower absorption of retail space.
- In Boise City, Idaho's industrial sector, the market cap rate increased from 6.1% in Q3 2021 to 6.3% in Q3 2022.
During the same period, the vacancy rate dropped from 3.1% to 2.5%. The inventory SF in the area increased from 50,694,518 in Q3 2021 to 52,282,430 in Q3 2022. However, the total sales volume in Q3 2022 decreased significantly to $10,308,437, down from the previous year's figure of $56,750,460.
- In Wichita, Kansas' office sector, the total sales volume in Q3 2022 was $2,367,000, which was a significant decrease from the $6,441,000 recorded in the same quarter of 2021.
During the same period, the vacancy rate increased from 6.8% to 7.7%, while the market cap rate remained steady at $18.
- Louisville/Jefferson County, Kentucky's multifamily sector had an inventory of 85,231 units in Q3 2022, up from 83,832 in Q3 2021.
The market cap rate decreased from 5.8% in Q3 2021 to 5.6% in Q3 2022, while the vacancy rate increased from 5.9% to 6.1% in the same period.
- In Q3 2022, the retail sector vacancy rate in Barnstable Town, Massachusetts decreased to 2.2% from the previous year's rate of 3.5%.
During the same period, the total sales volume increased from $20,165,666 to $63,126,388. Additionally, the area's market cap rate slightly increased from 6.8% to 6.9%.
- In Q3 2022, Detroit-Warren-Dearborn, Michigan's industrial sector market cap rate increased significantly to 8.7% from the previous year's rate of 8.5%.
The inventory SF increased from 612,263,523 in Q3 2021 to 617,493,285 in Q3 2022. However, the vacancy rate in the area increased from 4.4% to 4.7%.
- In Q3 2022, the total sales volume in the office sector of Las Vegas, Henderson, and Paradise, Nevada was $348,359,072, up from $266,039,072 in Q3 2021.
During the same period, the area's vacancy rates decreased from 10.6% to 9.8%, while the market cap rate dropped slightly from 7.4% to 7.3%.
- In Q3 2022, the multi-family sector vacancy rate in Trenton-Princeton, New Jersey decreased to 3.4% from 4.0% in Q3 2021.
The inventory units remained relatively stable, with 19,517 units in Q3 2021 and 19,536 units in Q3 2022. Additionally, the market cap rate in the area changed significantly from 4.7% in Q3 2021 to 4.5% in Q3 2022.
- In the retail sector of New York, Newark, and Jersey City, New York, the market cap rate remained steady at 5.9% from Q3 2021 to Q3 2022.
The total sales volume increased from $1,420,669,696 to $1,148,601,600 during the same period. However, the area's vacancy rates increased slightly from 4.0% to 4.1%.
- By Q3 2022, the total sales volume in the retail section of Bismarck, Nevada was $7,230,000
This was a decrease from the total sales volume of $10,394,175 in Q3 of the previous year. Its vacancy rates increased from 4.2% to 5.3% and its market cap rate, 7.9% to 7.7% in the same duration.
- In Columbus Ohio, the industrial sector’s vacancy rate in Q3 2022 was 3.5%, a drop of 4.5% year-over-year.
Still from Q3 2021 to Q3 2022, the area’s market cap rate slightly fell from 6.5% to 6.3%, and its total sales volume increased from $248,720,144 to $494,034,496.
- In Q3 2022, Salem, Oregon's office sector market cap rate dropped to 7.9% from 8.0% in Q3 2021.
During the same period, the total sales volume increased from $24,259,670 to $48,300,456, while the vacancy rate decreased from 4.6% to 3.9%.
- In Q3 2022, Pittsburgh, Pennsylvania's multifamily sector vacancy rate increased to 4.8% from 4.4% in Q3 2021.
During the same period, the inventory units increased from 99,537 to 100,818, while the market cap rate slightly dropped from 6.4% to 6.3%.
- From Q3 2021 to Q3 2022, the retail sector's vacancy rate in Providence-Warwick, Rhode Island-Massachusetts decreased from 4.5% to 3.4%.
The market cap rate for the area remained constant at 6.9% during the same period. Additionally, the total sales volume in the retail sector increased from $134,643,344 to $147,094,864.
- In Knoxville, Tennessee, the market cap rate for the industrial sector remained steady at 7.1% from Q3 2021 to Q3 2022.
During the same period, the total sales volume in the area increased from $42,127,924 to $33,830,352. Additionally, the vacancy rate in the industrial sector decreased from 1.2% to 1.1%.
- Salt Lake City, Utah's office sector experienced an increase in vacancy rate from 8.7% in Q3 2021 to 10.2% in Q3 2022.
However, the market cap rate for the same sector remained steady at 7.2% from Q3 2021 to Q3 2022. During the same period, there was a significant increase in the total sales volume, jumping from $5,666,574 to $25,120,900.
- In Q3 2022, the multifamily sector inventory units in Richmond, Virginia increased to 97,002 from 4.3% in Q3 2021.
During the same period, the area's vacancy rate increased from 4.3% to 6.5%, while the market cap rate slightly decreased from 5.3% to 5.1%.
Forecast 2025
The underlying fundamentals of the commercial real estate market in the U.S. have remained stable on a national level, owing to its healthy rental rate growth, high occupancies, and interest rates stabilizing. However, it is worth noting performances vary according to sectors. Some market segments are flourishing while others like the office sector have been under murky waters due to the changes brought about by the post-pandemic economy. Looking ahead, let's explore predictions based on the previous year's performance and beyond.
- The number of multifamily homes in the U.S. is projected to reach 155.25 million by 2023.
Additionally, the industry revenue of real estate in the U.S. is projected to reach approximately 553.3 billion by 2025.
- In 2023, the demand for industrial real estate in the U.S. is expected to rise by 850 million square feet.
This projected demand is equivalent to the combined industrial real estate space available in Salt Lake City and Atlanta. (
- The CAGR of the commercial real estate market in the U.S. is predicted to surpass 3.45% by 2028.
In 2021, some sectors of the commercial real estate industry have shown signs of moderate recovery. There have even been modest increases in the performance of some previously-depressed markets, such as the hospitality sector.
Conclusion
The current trends and movements in the U.S. commercial real estate market are displaying signs of weakening. Vacancy rates have been increasing, especially in office buildings, as remote work becomes more prevalent. Furthermore, interest rate shocks are a potential risk that may contribute to a bleaker future for the industry. Despite these challenges, some experts argue that it may be too soon to predict a systemic crisis for the industry, given the stability of the country's banking sector. The industry has faced significant stress and unfavorable factors, but it is not yet clear if it will lead to a crisis.
FAQs
Commercial
How big is the commercial real estate market in the US?
The commercial real estate (CRE) market is a significant sector within the overall real estate industry of the United States, with a market size of $1.2 trillion in revenue as of 2022. The CRE sector ranks as the fifth largest segment in the U.S. industry in terms of market size.
What is the growth rate of the commercial real estate industry?
The growth rate of the commercial real estate (CRE) industry can be influenced by various factors, including economic conditions, demographic trends, and government policies. However, recent data indicate a decline in the CRE market size by 6% in the previous year, indicating a challenging period for the industry. As of February 2023, specific CRE sectors, such as office and multifamily, have encountered more significant obstacles, with their vacancy rates exceeding 0.8 percentage points compared to the same period last year. In contrast, the industrial sector has demonstrated greater resilience, with a vacancy rate of 4.6%, the second-lowest after the retail sector. Remarkably, the retail segment of the CRE industry had over 3 million square feet more occupied than available for rent in rental space as of January 2023, suggesting a growing demand for retail space. Additionally, the hospitality sector experienced a notable increase in 12-month sales volume, reaching $61.7 billion as of January 2023, indicating positive growth in this sector.
What commercial real estate makes the most money?
The profitability of various types of commercial real estate can differ significantly based on factors such as property type, location, and market conditions. However, certain types of commercial real estate are typically considered to have higher potential returns compared to others.
As of now, the industrial sector is the top-performing asset class within the CRE market, while the retail sector is the lowest-performing segment.
What area of commercial real estate makes the most money?
The potential profitability of various areas in commercial real estate can differ significantly based on factors like location, market conditions, and property type. However, certain areas in commercial real estate are typically considered to have higher potential returns than others. These areas include investment properties, development properties, properties located in high-demand markets such as major metropolitan areas, and those with strong job growth.
It's important to note that commercial real estate investing can be complex and requires careful consideration of various other factors beyond just potential returns, such as financing, taxes, and maintenance costs.
Who is the largest commercial real estate owner?
Blackstone, the largest commercial real estate owner in the U.S. with a portfolio of $325 billion, holds the majority ownership of office properties across the country. Its diverse portfolio includes hotels, office buildings, and other properties, along with 179 million square feet of retail space, 153 million square feet of industrial space, and 96,000 multifamily units.
How profitable is commercial real estate?
Commercial real estate is dubbed as a reliable venue for investors to generate profit. Its average return is 9.5%, and when it comes to some real estate investment trusts (REITs), the average return increases to 11.8%. While the CRE returns may vary according to factors like location, property type, and market conditions, its usual investment returns range from 6% to 12% annually.
What state has the cheapest commercial property?
The cost of commercial property can vary widely depending on a variety of factors, such as location, property type, and market conditions. However, some states may offer more affordable commercial real estate options than others.
Mississippi is the most affordable state to purchase a commercial property. The state has the lowest cost of living in the U.S., and this is great news for businesses in search of properties to lease or sell. In addition to its lowest cost of living, it is also quite accessible and provides abundant space to work with. These are factors that make it the least costly state for CRE.
Which asset is the most liquid commercial real estate?
Class A properties are typically modern buildings that are well-maintained and located in highly sought-after areas, such as central business districts. They usually have long-term leases with creditworthy tenants, which provides a stable income stream for investors. These properties are considered the most liquid assets in commercial real estate due to their prime locations, stable cash flows, and high market demand. As a result, they typically attract a large pool of potential buyers and can be sold quickly and at a fair market value. Due to these factors, Class A properties are highly desirable among investors and trade at lower capitalization rates than other asset classes, resulting in a higher value per dollar of income generated.
Sources
- ibisworld.com
- statista.com
- nar.realtor
- moodysanalytics.com
- eia.gov
- mordorintelligence.com
- deloitte.com
- commercialedge.com
- cbre.com
- colliers.com
- jll.com
- nicmapvision.com
- myelisting.com
- ioptimizerealty.com
- companiesmarketcap.com
Frequently Asked Questions