


Key takeaways
- In 2022, the median home prices in Texas rose by 13.3%, going up from $300,000 to $340,000.
- At the end of 2022, the occupancy rate for the retail sector in Dallas increased to 93.8%, up from 93.3% in 2021.
- In 2022, rental apartments in Dallas had an occupancy rate of over 95%.
- As of Q1 2023, 2.9% of properties statewide in Texas were valued at more than $1 million.
- Caldwell County saw a significant increase in its housing inventory, which jumped from 2.1 months to 3.3 months.
- In Q1 2023, Abilene MSA's median price increased by 3.6% YoY to $229,000, while active listings surged by 83.6% to reach 547.
Research Summary: Texas has been recognized as an affordable place for families to live, with its metropolitan areas consistently ranked among the country's most affordable housing markets. However, the state's real estate market has undergone changes due to global and economic factors. Here are some statistics that reflect the current state of the Texas real estate market:
To facilitate accessibility, we have categorized the information in the following manners:
Residential Real Estate | Commercial Real Estate | Rental Market | Luxury Real Estate | Demand and Supply | Trends by City
Residential Real Estate
The Texas residential real estate market has steadily prospered in recent years, with an increase in home prices and rising demand for housing. Despite this, Texas remains an affordable state to live in, with housing costs not surpassing the national average. The state's real estate market is robust, with high sales volume and low inventory levels. To learn more about how Texas real estate has been doing, check out the figures below:
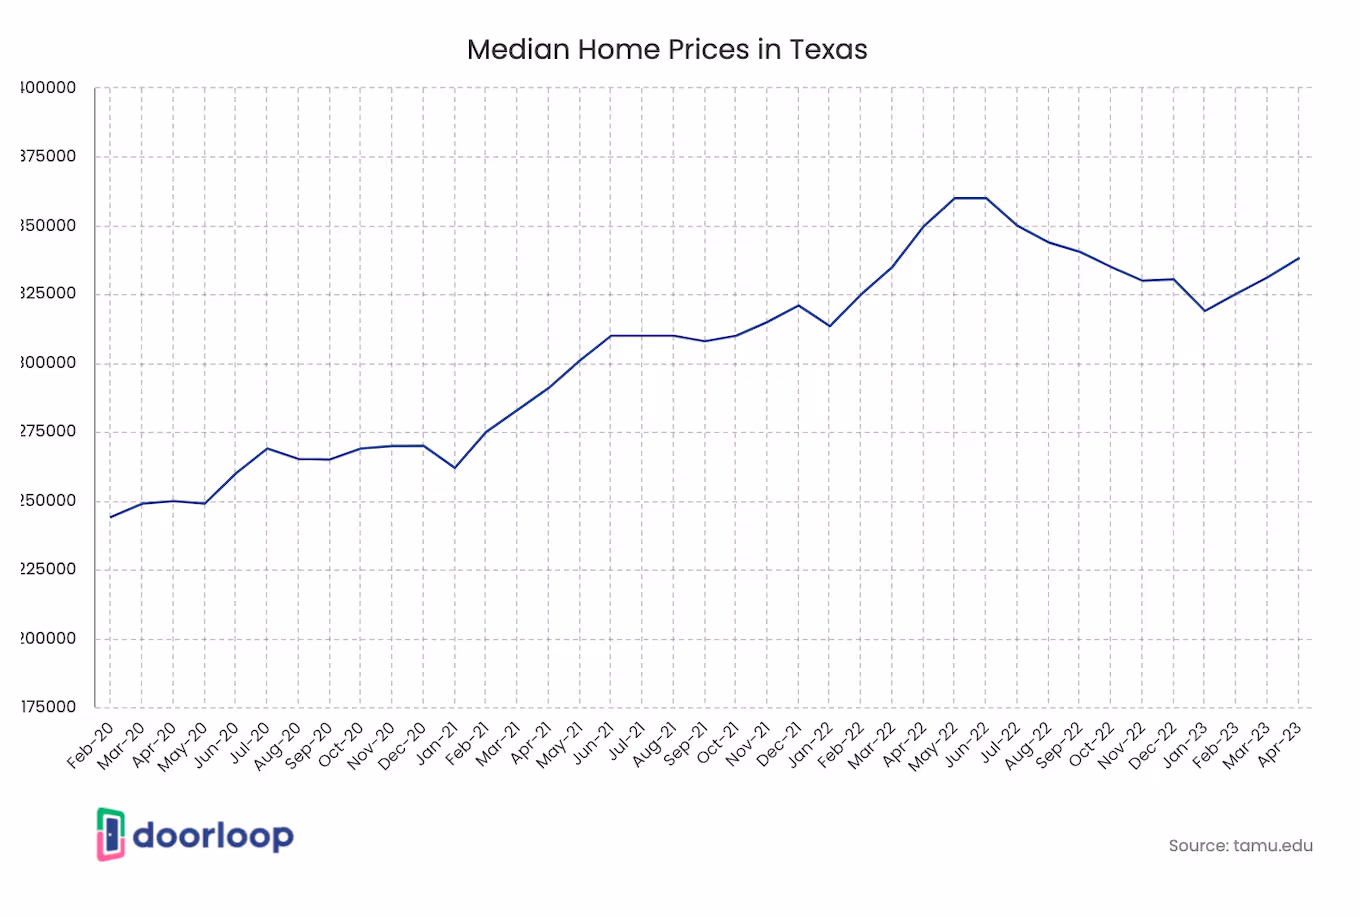
- In 2022, the median home prices in Texas rose by 13.3%, going up from $300,000 to $340,000.
While this indicates a deceleration in growth compared to the sizeable 16.2% increase seen in 2021, it aligns with the upward trend recorded before 2021.
- Killeen-Temple saw the highest growth rate in 2022, increasing by 19%, making it the market with the largest rise in housing prices.
On the other hand, Midland had the lowest price appreciation with a growth rate of just 4%. It is worth mentioning that in 2021, Austin had the highest rate of growth, with sale prices increasing by 31%.
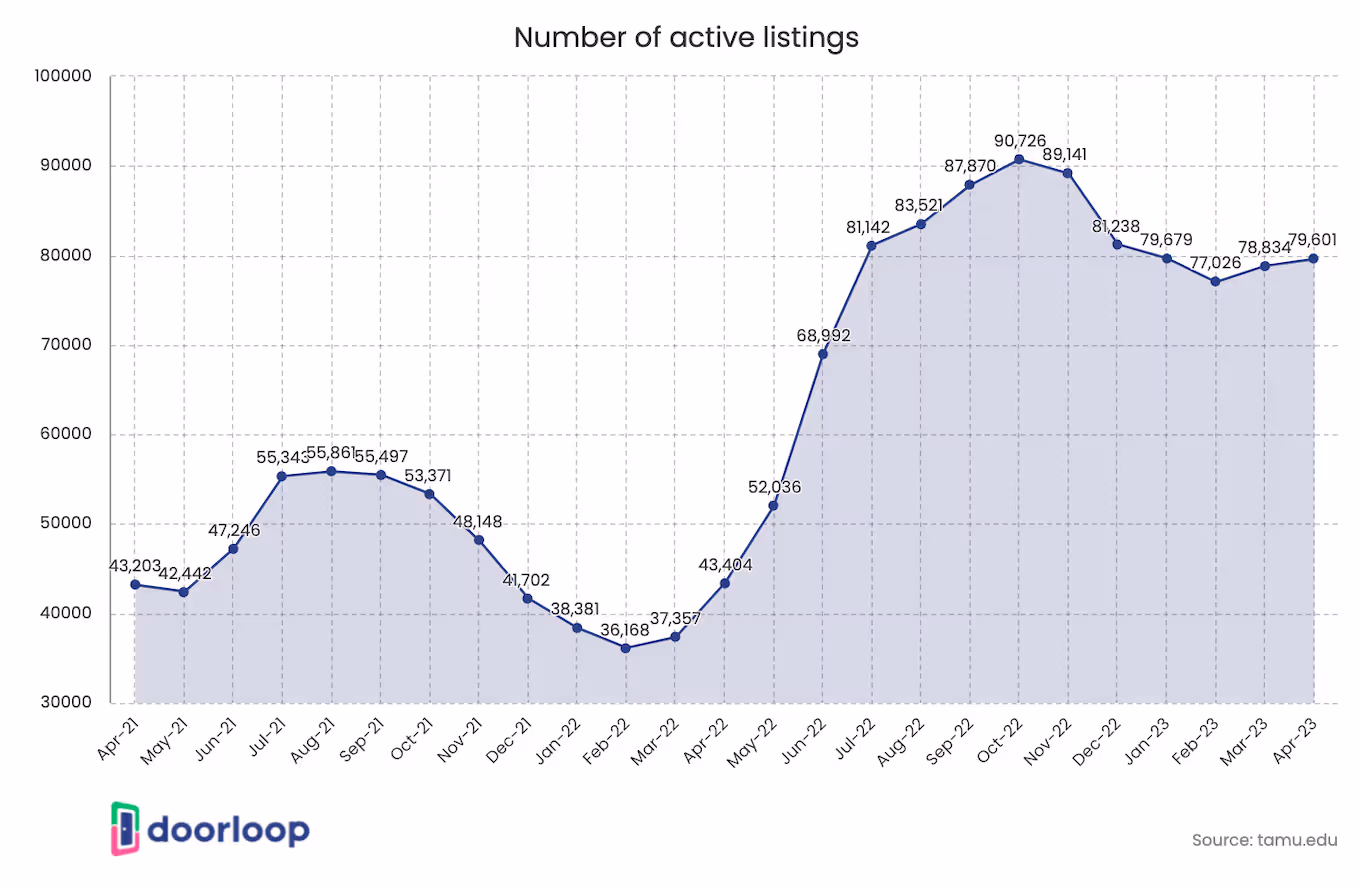
- Texas had an increase in active listings by 36.9% from 2021 to 66,160 in 2022.
Its months of inventory was 2.7, up from 1.2 in 2021. Properties stayed on the market for 35 days, 1 day more than the previous year. Its median price per square foot was $174.17 up 15.9 from 2021.
- In Caldwell County, home sales fell by 14.3% to 42 closed sales, and sales volume dropped by 17.3% to $14,423,495.
The median home price decreased by 15.1% year over year, reaching $297,000. Meanwhile, new listings surged by 38.7% to 86 listings, and active listings soared by 245.0% to 138 listings.
- In March 2023, home sales in Bastrop County dropped by 14.1% year over year, with 122 sales recorded, and sales dollar volume decreased by 24.1%, reaching $49,966,019.
The median price fell by 5.3% to $380,000, while new listings saw a slight increase of 22.9%, with 215 listings added. Active listings surged by 220.9% to 507 listings, and pending sales rose by 35.8% to 167 pending sales.
- In March 2023, residential home sales dropped by 18.8% YoY to 2,611 closed sales. Sales dollar volume decreased by 29.3% to $$1,545,088,361, while new listings fell by 10.6% year-over-year to 4,115. However, pending sales saw a slight increase of 0.2% to 3,267 transactions in progress.
- As of April 2023, Hays County saw a slight increase of 1.1% in home sales, with 361 closed sales recorded.
However, sales dollar volume experienced a notable decline of 19.0%, reaching $182,586,736. The median home price also dropped by 16.9% to $416,500. Pending sales saw a decrease of 8.5%, with 445 pending sales.
- In Q1 2023, Texas recorded a year-over-year increase of 0.6% in median home price, reaching $326,800.
This suggests that the demand for housing in the state remains robust, and the increase in housing inventory has yet to surpass the demand in the Texas market.
- In Q1 2023, approximately 27.2% of properties in Texas were priced between $200,000 and $299,999.
Properties with a price range of $300,000 to $399,999 accounted for 24.5% of the state's properties, while 32% of properties were priced between $0 and $99,999.
- As of April 2023, home sales in the city of Austin recorded a significant decline of 31.0% to 740 closed sales.
There was also a notable reduction of 34.8% in sales dollar volume, reaching $543,967,464, and a drop of 11.4% in median home price, with prices reaching $565,000. Pending sales saw a decline of 9.9%, with 949 pending sales.
- Travis County recorded a decline of 28.6% in home sales, with only 1,167 closed sales in April 2023.
Sales dollar volume also saw a substantial drop of 34.9%, reaching $839,004,026. The median home price in Travis County fell by 13.3% year over year to $537,500. Additionally, pending sales saw a decrease of 8.5%, with 1,502 pending sales.
- In April 2023, Williamson County saw a decline of 11.2% in home sales, with only 919 closed sales.
Similarly, sales dollar volume experienced a substantial drop of 22.2% year over year, reaching $457,918,942. The median home price in Williamson County was reduced by 12.8%, with prices reaching $445,000. However, there was a slight increase of 4.7% in pending sales, with 1,092 transactions in progress.
Commercial Real Estate
The Texas commercial real estate landscape faces a number of challenges, including the threat of recession, ongoing inflation, and legislative measures that could impact commercial property owners in the retail, office, and industrial sectors. As the demand for office space continues to shrink, companies are preparing for a possible recession due to the turbulent economy. Despite these challenges, certain areas in Texas, such as Austin, are considered excellent target markets for commercial real estate. In the following insights, we'll take a closer look at how the state's commercial real estate market has been performing.
- At the end of 2022, the occupancy rate for the retail sector in Dallas increased to 93.8%, up from 93.3% in 2021.
This rate was determined based on a review of 1,002 projects, with an overall market inventory of 137.4 million square feet.
- In Fort Worth area, the retail sector occupancy rate was 95.6 percent, compared to 93.9% at year-end 2021.
This rate was according to 429 retail projects with an overall inventory of 62.2 million square feet.
- In Q1 2022, Austin was the most expensive market in the office sector, with its rental rate of class A offices worth more than $50 per square foot.
El Paso, on the other hand, only had $26 per square foot. The largest office real estate market in the state was Dallas, which had around $29 rental states for all classes and $34 for class A offices. Austin also had the highest rental rates.
- The rental rate of Deep Ellum-Lakewood’s class A office space was roughly $49.15 per square foot in Q1 2023.
In all of Dallas-Fort Worth, Deep Ellum-Lakewood was the most expensive market for office real estate. It is worth mentioning that East NE Fort Worth only had $20 per square foot. Dallas also had the most inventory compared to the major office markets in Texas.
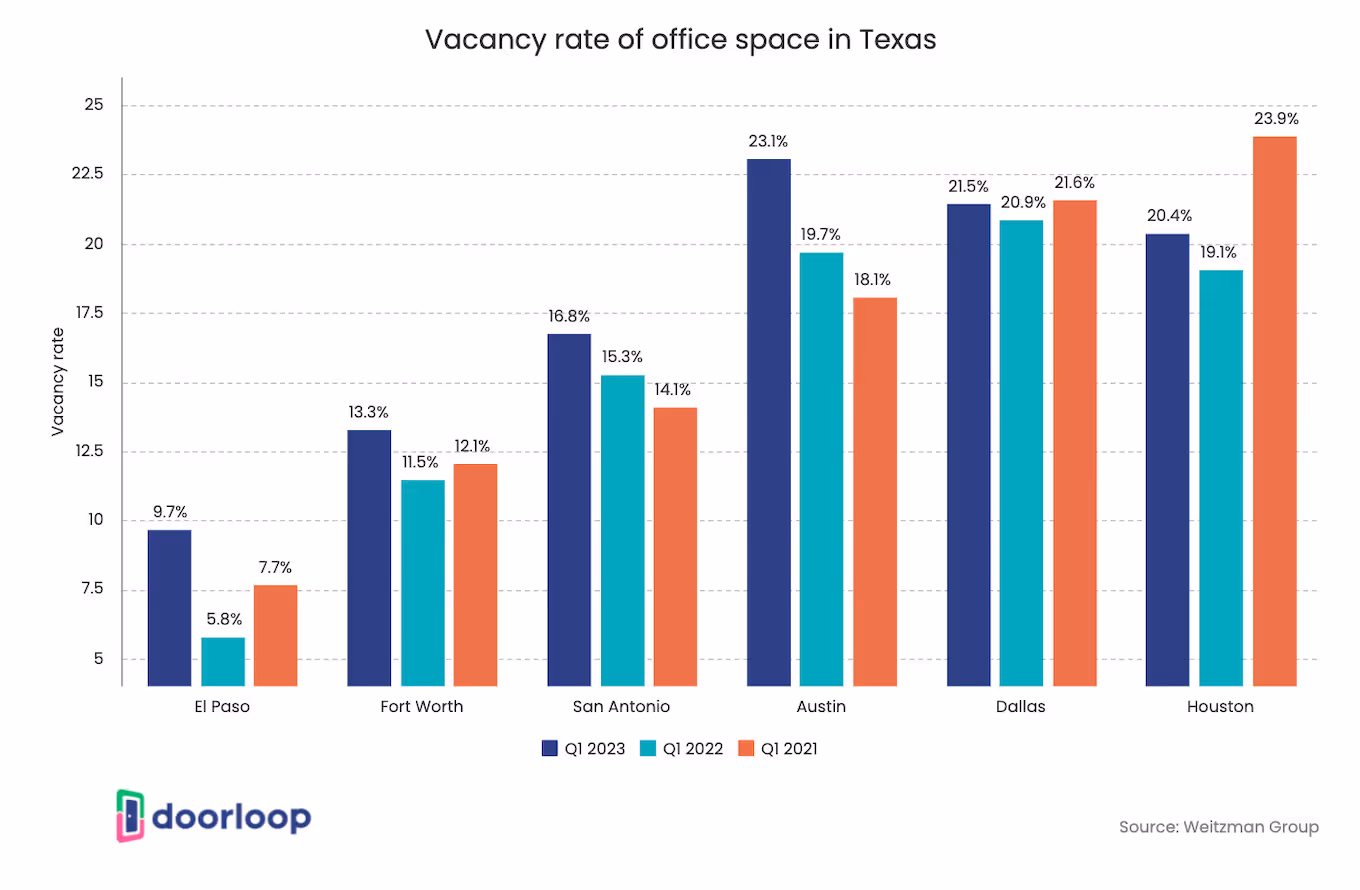
- As of Q1 2022, approximately 6% of offices in El Paso were vacant.
It was compared to Houston which had nearly 20%. The coronavirus pandemic outbreak played a significant role in the increase in office vacancies in the office sector.
- As of Q1 2023, the rent per square foot in Austin's multifamily sector was $1.83, which represents a 0.36% decrease year-over-year.
However, the vacancy rate in the multifamily sector increased by 1.43% year-over-year to 8.70%. On the other hand, the rent per square foot in the office sector was $30.16, indicating a 2.75% increase year-over-year. The vacancy rate also saw a slight change from current to year-over-year, with 17.40% and 2.07%, respectively.
- As of Q1 2023, the retail sector's rent per square foot in Dallas-Fort Worth was $18.22, indicating a significant year-over-year increase of 7.45%.
Meanwhile, the vacancy rate for the retail sector decreased by 0.47% year-over-year, with a current rate of 5.60%. The warehouse sector, on the other hand, had a rent per square foot of $7.41, representing a substantial increase of 17.06%. Additionally, the vacancy rate for the warehouse sector decreased by 0.43% year-over-year, with a current rate of 5.90%.
- As of Q1 2023, the rent per square foot in the office sector in Houston was $20.89, indicating a year-over-year increase of 1.34%.
However, the vacancy rate in the same sector saw a modest increase of 0.07%, reaching 23.10%. In the multifamily segment, the rent per square foot was $1.41, showing a year-over-year increase of 1.20%. However, the vacancy rate in the multifamily sector increased by 1.13% year-over-year, reaching 8.90%.
- San Antonio, Texas saw a year-over-year increase of 9.70% in the rent per square foot in the warehouse sector, reaching $7.31 as of Q1 2023.
The vacancy rate in the same segment saw a significant decrease of 1.63% year-over-year, with a current rate of 2.70%. In the retail sector, the rent per square foot was $16.64, indicating a year-over-year increase of 5.43%. Additionally, the vacancy rate in the retail sector decreased by 0.57% year-over-year, with a current rate of 4.30%.
Rental Market
Texas is renowned for its abundance of affordable properties, which makes it an excellent location to invest in rental properties. The state's growing population, thriving economy, and landlord-friendly laws are among the factors that make it appealing to investors. However, rental market performance varies across different areas of the state. Here is the latest data on the rental market in Texas:
- El Paso dominated the rental apartment market in 2022 with a Rental Confidence Index of 77.2.
During that year, the occupancy rate was over 96%, and only a few rentals were constructed. The supply of apartments increased by 0.7%, and more than 60% of renters chose to renew their leases.
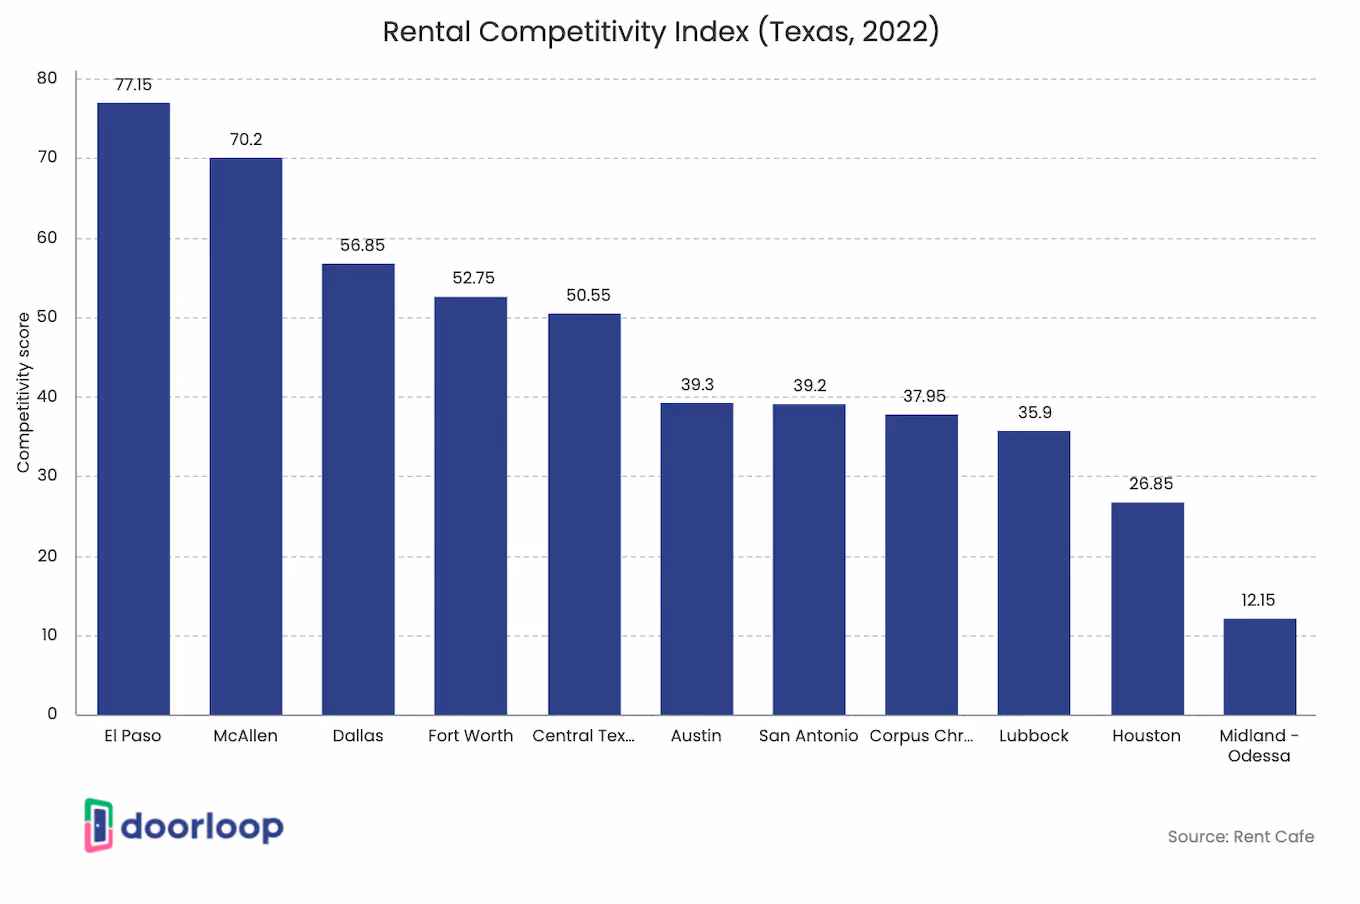
- McAllen was the state's second hottest rental market in 2022, with an average apartment occupancy rate of 96.2%.
Nearly 68% of renters not only chose to remain but also renewed their leases, contributing to a Rental Confidence Index score of 70.2, which is almost double the state's score of 44.4.
- In 2022, rental apartments in Dallas had an occupancy rate of over 95%.
This high occupancy rate was mainly attributed to the fact that nearly 63% of renters chose to renew their leases, contributing to Dallas' Rental Confidence Index score of 56.9. Similarly, Fort Worth recorded a Rental Confidence Index score of 52.8 in the same year.
- The overall apartment occupancy rate in Dallas-Fort Worth was 94.1% in Q1 2022, with the Class A apartment occupancy rate at 93.1%.
Additionally, it is worth mentioning that the area's overall asking rent was 15.4%, while its Class A asking rent was 17.3%.
- As of Q1 2022, the overall asking rent for apartments in Austin was 17.5%, while the Class A asking rent was 18.2%.
Additionally, the area's overall apartment occupancy rate was 93.3%, with the Class A apartment occupancy rate at 92.9%.
- San Antonio, Texas had an overall apartment occupancy rate of 93.8% in the first quarter of 2022, with a higher occupancy rate of 94.6% for Class-A apartments. The overall asking rent for apartments was 13.1%, whereas the Class-A asking rent was 15.4%.
- In Q1 of 2022, the asking rent for overall apartments in Houston was 9.9%, and for Class A apartments, it was 11.7%.
The overall occupancy rate was 92.5%, while for Class A apartments, it was 91.0%.
Luxury Real Estate
Luxury homes have fueled growth in Texas' housing market, particularly in Austin, Dallas-Fort Worth, and Houston. With its diverse landscape featuring majestic canyons, deserts, beaches, and lakes, Texas is a prime location for high-end real estate. The state boasts some of the most exclusive and trendsetting homes. For more information on Texas' luxury real estate market, see the statistics below:
- As of Q1 2023, 2.9% of properties statewide in Texas were valued at more than $1 million.
In the Austin-Round Rock Metropolitan Statistical Area (MSA), this percentage was higher at 6.7%, while in the Dallas-Fort Worth-Arlington MSA and Corpus Christi MSA, it was 3.9% and 2.7%, respectively, in the previous year.
- In the period spanning from November 2021 to October 2022, the number of homes sold for $1 million or more rose by 17% compared to the previous year.
There were a total of 13,998 sales in this category, which generated a combined dollar volume of $22.6 billion. This represents a 14% increase in dollar volume from the preceding year.
- In 2022, the number of homes that sold for a minimum of $1 million accounted for 3.6% of all residential properties sold in the state.
It was a 0.8% increase from last year. Further, there was a 14.2% total dollar amount of all residential sales dollar volume across Texas.
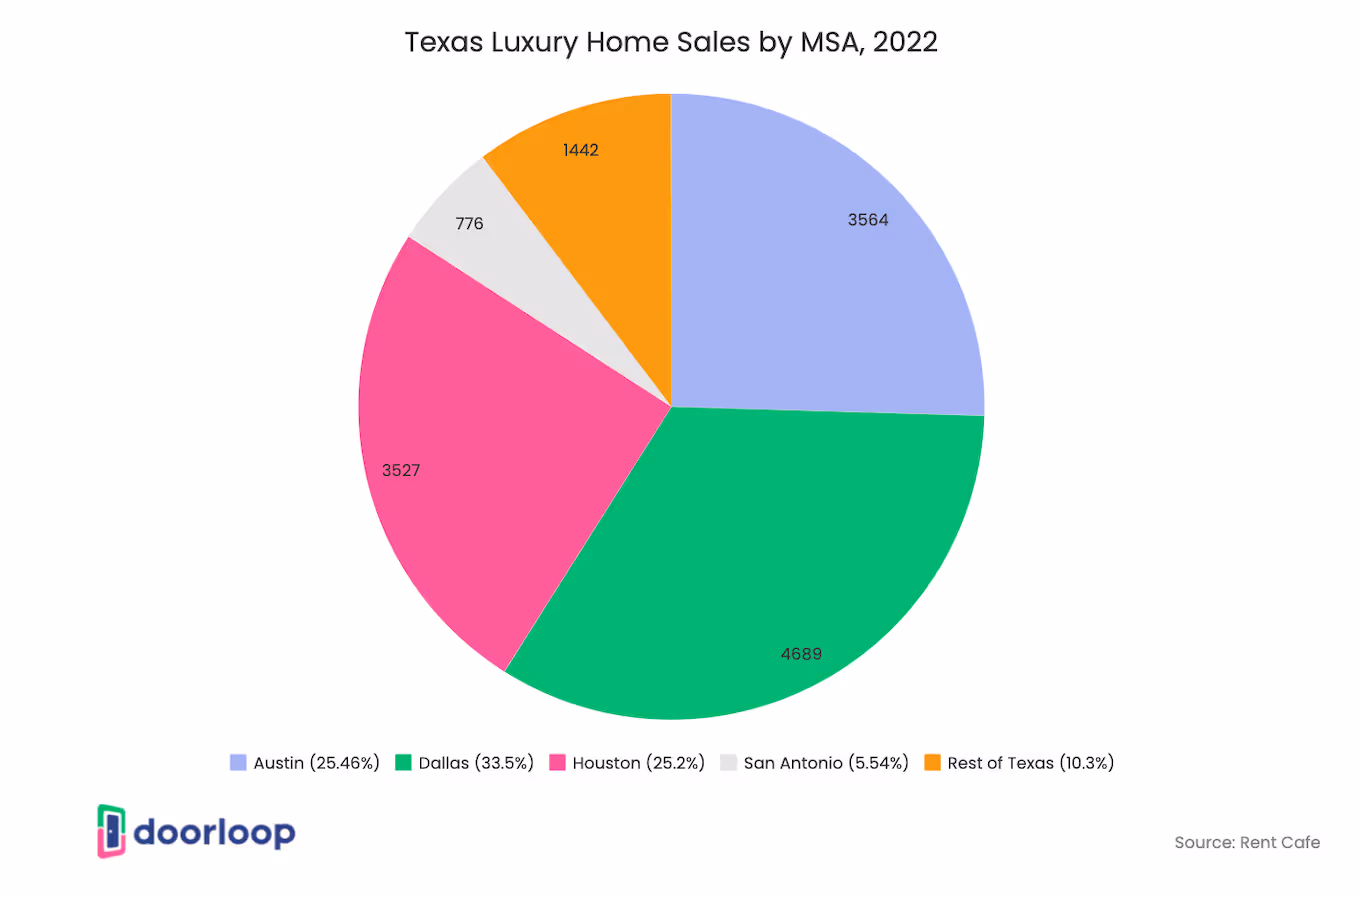
- In the quarter ending November 2022, luxury home sales in Austin dropped by 40.9%.
This was accompanied by a year-over-year increase of 51.0% in active listings and a 20.2% increase in new listings. The median sale price in Austin during this period was $1,889,500.
- For the three-month period ending in November 2022, high-end home sales in Dallas experienced a year-over-year decline of 30.9%.
Despite this, there was a notable increase of 19.1% in active listings and a 5.9% increase in new listings during the same period. The median sale price for homes in Dallas was $1,350,000, representing a significant year-over-year change of 17.4%.
- During the quarter ending in November of the previous year, Fort Worth experienced a 36.3% year-over-year decline in luxury home sales.
However, there was a year-over-year increase of 13.5% in active listings and a decrease of 2.9% in new listings during the same period. The median sale price in the area was $1,040,000, representing a year-over-year change of 14.8%.
- Luxury home sales in Houston experienced a year-over-year decline of 36.4% during the quarter ending in November 2022.
In the same period, there was a 2.1% year-over-year increase in active listings, while new listings saw a 1.5% year-over-year decrease. The area's median sale price was $1,095,000, representing a significant year-over-year change of 15.0%.
Demand and Supply
Texas has a reputation for constructing more homes than any other state in the U.S. Despite this, there is a growing consensus among builders, housing advocates, and real estate experts that the state is not building enough homes to keep up with its rapid economic growth and population expansion. The demand for housing in Texas is driven by corporate buyers and millennials, yet the limited supply of homes has led to historic highs in home prices and rents. Below are some insights from our research that provide a better understanding of the demand and supply dynamics in the Texas real estate market.
- Caldwell County saw a significant increase in its housing inventory, which jumped from 2.1 months to 3.3 months.
This increase was accompanied by a 38.7% jump in new listings, bringing the total to 86. Additionally, active listings in the area experienced a remarkable increase of 245.0%, reaching 138 listings.
- Bastrop County's housing inventory increased by 2.9 months to reach 4.1 months of inventory, the highest in April across MSA.
New listings rose by 22.9% to a total of 215 listings, while active listings surged by 220.9% to reach 507 listings.
- In April 2023, the housing inventory in Travis County saw a year-over-year increase of 2.5 months, reaching a total of 3.3 months of inventory.
Concurrently, the county experienced a decrease in new listings, with a reduction of 7.7% to 2,047 listings. However, the number of active listings in the county saw a significant surge, increasing by 211.5% to 3,975 listings compared to the previous year.
- Homes had an average market time of 47 days between January and October 2022, which was three days shorter than the same period in 2021.
Notably, luxury homes, priced at a million dollars or more, typically spent more time on the market than homes with lower price points.
- In March 2023, housing inventory in Austin-Round Rock increased to 3.2 months, but with a corresponding 53-day increase in the average market time to 71 days. Median home price also dropped by 15.1% to $466,705, while active listings surged by 216.0% to 2,357.
- In Williamson County, the housing inventory experienced a significant increase from 0.7 months to 2.6 months, marking a substantial rise of 1.9 months.
While this increase was accompanied by a 19.8% decrease in new listings, the number of active listings in the county skyrocketed by 178.0% to reach a total of 2,346 listings.
- In April of this year, Hays County saw a significant decline of 12.2% in new listings, with only 520 listings reported.
However, this reduction was offset by a remarkable surge in active listings, which increased by 243.5% to reach a total of 1,319 listings. Additionally, the county witnessed a drop of 2.6 months in housing inventory, which now stands at 3.6 months. These figures suggest that the housing market in Hays County remained robust, despite the decline in new listings.
Trends by City
Texas' real estate market has been on a steady path towards stabilization in 2022, following the pandemic-related volatility of the previous year. The state has shown a consistent increase in sales prices, indicating the resilience of the real estate market. Furthermore, the gap between original list prices and sales prices has narrowed, reflecting a more balanced market. Despite the overall positive trend, there is ongoing interest in how different areas in Texas are performing in the real estate market. Therefore, it is worth exploring the latest real estate trends in the first quarter of 2023 to gain a deeper understanding of the market's dynamics.
- In Q1 2023, Abilene MSA's median price increased by 3.6% YoY to $229,000, while active listings surged by 83.6% to reach 547.
However, closed sales dropped by 12.6% to 498. Properties in the $750,000-$999,999 range accounted for 1.6%, while 8.7% of properties were priced from $0 to $99,999.
- The active listings in Austin-Round Rock MSA jumped 377.7% at 8,059 in the first quarter of 2023.
There was a drop in its median price by 11.2% year-over-year to $444,050 and 18.7% in closed sales to 6,549. Properties remained unsold on the market for 80 days, an increase of 46 days compared to Q1 2022.
- In Q1 2023, approximately 35.8% of properties in Brownsville-Harlingen MSA were priced between $200,000 and $299,999.
The median price increased by 1.9% YoY to $246,750, while closed sales declined by 12.1% to 576. Active listings, on the other hand, surged by 114% to 858. Properties in the area stayed on the market for an average of 62 days, which is two days longer than the same quarter of the previous year.
- The closed sales in Corpus Christi MSA dropped 22% to 1,209 in Q1 2023.
There were, however, increases in its median price by 1.5% year-over-year to $272,595 up 1.5%, and its active listings by 64.5% at 1,823. Around 30.6% of its properties fell within the price range of $200,000 and $299,999.
- In Q1 2023, Dallas-Fort Worth-Arlington MSA's median price increased by 1.5% YoY to $385,000, with 28.8% of properties priced between $300,000 and $399,999.
Despite an active listing surge of 129.8% to 16,467, closed sales decreased by 8.4% to 20,166.
- In Q1 of 2023, nearly 50% of properties in El Paso MSA were priced between $200,000 and $299,999, with an average market time of 59 days.
The median price increased by 9.9% YoY to $245,000, and active listings surged by 72.6% to 1,609. Unfortunately, there was a 20.9% drop in closed sales, which fell to 1,814.
- In Q1 2023, closed sales in Houston-The Woodlands-Sugar Land MSA dropped 24.2% to 18,607.
Approximately 32.3% of these sales were within the price range of $200,000 to $299,999. Although the median price in the area dropped by 0.5% to $320,000, active listings surged by 85.4% to 19,823.
- Approximately 43.7% of properties in Killeen-Temple MSA cost between $200,000 and $299,999 in Q1 2023.
Further, 7.3% were priced from $500,000 to 749,999. There was a 5.9% year-over-year increase in its median price at $260,530. For its active listings, were was an increase of 292.5% at 1,303, but its closed sales declined 21.9% at 1,469.
- In Q1 2023, the highest price distribution for properties in Laredo MSA was in the range of $200,000-$299,999, accounting for 44.9% of sales.
The median price increased by 5.6% YoY to $225,000, and active listings surged by 74.4% to 333. However, closed sales dropped by 15.1% to 276. Properties remained on the market for an average of 45 days, which is six days less than the same quarter in 2022.
- In Q1 2023, Midland MSA's median price dropped by 1.4% to $315,000, with properties priced between $200,000 and $299,999 accounting for 33.2% of sales. Active listings declined by 4.4% to 473, and closed sales dropped by 10.6% to 675. Properties in the area stayed on the market for an average of 52 days, four days less than the previous year.
FAQs
What is the process for buying a home in Texas?
Buying a home in Texas typically requires finding a real estate agent, obtaining a mortgage pre-approval, looking for suitable properties, presenting an offer, negotiating the contract terms, conducting a home inspection, and finalizing the sale. The timeline for each of these stages is subject to the unique circumstances of the transaction.
Are there any special requirements for buying land in Texas?
While there are no special requirements for buying land in Texas, it's important to research zoning laws, environmental regulations, and other factors that could affect land use. Additionally, local authorities may require permits or approvals before building or developing on the land.
Will Texas home prices go down in 2023?
Housing prices may fluctuate based on the location. For instance, in Dallas, TX, there is a projected 0.1% decrease in housing prices as of April 2023, followed by an additional 0.3% decrease in June 2023. Nonetheless, the prices are expected to increase by 0.7% by March 2024.
Is the housing market in Texas going to crash?
It's unlikely that the housing market will experience a crash in Texas, as evidenced by low months of supply, limited availability of newly constructed properties, an influx of new homebuyers, strict loan standards, and fewer foreclosures.
Where are the hottest real estate markets in Texas?
The Austin-Round Rock metro region has been booming lately, with significant growth occurring during the pandemic. Although the growth rate has tapered off recently, the area still boasts the highest median home sale price in the state.
What is the homestead exemption in Texas?
To limit the amount of property tax due on your primary residence, you can apply for the homestead exemption in Texas. The exemption conditions include owning and residing in the property as your primary residence by January 1 of the tax year. The amount of exemption granted varies based on property type and other criteria, but it can lead to significant savings on property taxes.
Does Texas have a housing shortage?
Texas, which constructs more homes than any other state, is still unable to match its tremendous population and economic growth, resulting in record-high housing expenses, as per housing advocates, builders, and real estate experts. According to certain estimates, the state requires hundreds of thousands of additional homes.
Conclusion
Texas is increasingly popular for people moving across the U.S. for work or real estate investment. This has led to a lack of inventory and higher housing prices. However, in 2023, experts consider Texas one of the most desirable real estate markets, particularly the suburbs of major metropolitan areas that are expected to experience accelerated growth, making them attractive for homebuyers and investors.
Sources
- texasrealestate.com
- abor.com
- weitzmangroup.com
- statista.com
- assets.recenter.tamu.edu
- rentcafe.com
- redfin.com
Frequently Asked Questions